Back to Articles

Introduction to the Ishikawa Fishbone Diagram
With over two decades in business – spanning strategy consulting, tech startups and executive leadership – I am committed to helping your organization thrive.
At Reliability, we’re on a mission to help enhance strategic decision-making and operational excellence through the power of Root Cause Analysis (RCA), and I hope this article will be helpful!
Our goal is to help you better understand Fishbone Diagram by offering insights and practical tips based on years of experience. Whether you’re new to doing RCAs or a seasoned pro, we trust this will be useful in your journey towards working hard and working smart.
Fishbone Diagram, also known as the Ishikawa or cause-and-effect diagram, is a pivotal tool in problem-solving and quality management. Originating from the quality management field, it has found widespread application across various industries. This guide aims to provide a thorough understanding of the Fishbone Diagram, its construction, and its practical applications.
What is an Ishikawa Fishbone Diagram?
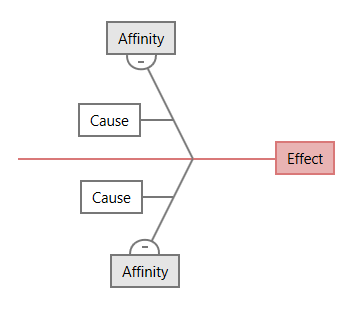
Ishikawa Fishbone Diagram is a visual tool used for identifying and analyzing the root causes of a problem. Named after its creator, Dr. Kaoru Ishikawa, and its resemblance to a fish skeleton, the diagram is instrumental in breaking down the cause of a problem into manageable, visual chunks.
Key Features:
- Visual Representation: It graphically displays the relationship between a given outcome and all the factors influencing it.
- Problem-Oriented: Focuses on identifying the root causes of problems, not just symptoms.
- Collaborative Tool: Encourages team participation and brainstorming.
How Does the Ishikawa Fishbone Diagram Work?
The Ishikawa Fishbone Diagram works by breaking down, categorizing, and analyzing the causes of a problem in a visual and structured manner. It turns complex, interconnected issues into a clear map of cause and effect, guiding teams towards effective problem-solving and decision-making.
Creating a Fishbone Diagram involves several systematic steps:
1. Define the Problem
- Clearly articulate the problem or effect.
- Place this at the head of the diagram.
2. Draw the Backbone
- Extend a straight line from the problem statement.
- This acts as the main axis of the diagram.
3. Identify Major Categories
- Brainstorm broad categories of potential causes.
- Common categories include Methods, Machines, People, Materials, Measurement, and Environment.
4. List Specific Causes
- Under each category, list down specific factors contributing to the problem.
- These are the smaller bones branching from the main ones.
5. Deepen the Analysis
- Use iterative questioning, like “why does this happen?”, to delve deeper into each cause.
- This helps in identifying the root causes.
6. Organize and Prioritize
- Arrange the causes in terms of their potential impact.
- Prioritize them based on likelihood and severity.
Tips for Effective Ishikawa Fishbone Diagrams
When constructing an Ishikawa Fishbone Diagram, the key to effectiveness lies in thorough and collaborative brainstorming. It’s essential to involve team members from various departments or areas of expertise, as this diversity in perspectives can lead to a more comprehensive exploration of potential root problems.
- Engage Your Team: Utilize the diverse perspectives of team members for a comprehensive analysis.
- Stay Focused: Keep discussions relevant to the problem at hand.
- Use Visual Aids: Employ tools like whiteboards or software like Lucidchart for better visualization.
- Test for Root Causes: Identify patterns and repeated causes across categories.
Another straightforward technique for drilling down to a root cause is the 5 Whys Method. Consider combining it with the Ishikawa Fishbone Diagram brainstorming for deeper insights.
Types of Ishikawa Fishbone Diagrams
Variations of the Ishikawa Fishbone Diagram have been developed to cater to different industries and problem types, each adapting the basic structure to fit specific needs. Here are some of the notable variations:
Standard Fishbone Diagram
This is the classic version, often used in manufacturing and engineering. It typically includes categories like Machines, Methods, Materials, Manpower, Measurement, and Environment. This version is versatile and can be adapted to a wide range of problems.
5M/1E Fishbone Diagram

An extension of the standard model, this version includes Machines, Methods, Materials, Measurements, Mother Nature (Environment), and Manpower. It’s often used in industries where environmental factors are a significant concern, such as in agriculture or energy sectors.
4S Fishbone Diagram

Particularly popular in service industries, this variation categorizes causes into four main areas: Surroundings, Suppliers, Systems, and Skills. It’s useful for problems where external factors, like supplier issues or environmental conditions, play a significant role.
8P Fishbone Diagram

Commonly used in marketing and management, this variation includes Product, Price, Place, Promotion, People, Process, Physical Evidence, and Performance. It’s particularly effective for analyzing issues in business strategies and marketing campaigns.
What do you use a fishbone diagram for?
Imagine a manufacturing company facing quality issues with its products. By using the Fishbone Diagram, the team identifies several potential causes under different categories:
- Under ‘Machines’, they find that certain equipment is outdated.
- ‘Methods’ reveals inconsistencies in the manufacturing process.
- ‘People’ highlights a need for additional training for staff.
By addressing these specific areas, the company can implement targeted improvements, leading to enhanced product quality.
Ishikawa Fishbone Diagram Template
EasyRCA offers a range of versatile templates to suit various RCA needs, including the robust Causal Tree and notably, the Fishbone Diagram Template, which utilizes the comprehensive 6M method (Man, Machine, Material, Method, Measurement, and Mother Nature).

This Fishbone Diagram Template is particularly user-friendly and adaptable, allowing users to fully engage with the analysis process. With EasyRCA’s Fishbone Diagram Template, users can effortlessly add additional elements to their diagram, rearrange boxes for better organization and clarity, or remove components that are not relevant to their specific investigation.
This level of customization ensures that each Fishbone Diagram is not only thorough in its exploration of potential causes but also tailored to the unique context of the problem being addressed. The user-centric design of EasyRCA places complete control in the hands of the user, making the process of root cause analysis both efficient and effective.
Whether you’re dealing with complex industrial problems or seeking clarity in process improvement, EasyRCA’s Fishbone Diagram Template is an essential tool for insightful, structured problem-solving.
Mastering the Fishbone Diagram equips teams with a robust framework for problem-solving. By systematically dissecting and analyzing the root causes of issues, organizations can develop targeted solutions, leading to significant improvements in processes and outcomes.
I hope you found this guide to fishbone diagram insightful and actionable. For a broader overview of methodologies, check out our list of 7 Powerful Root Cause Analysis Techniques. Stay tuned for more thought-provoking articles as we continue to share our knowledge. Success is rooted in a thorough understanding and consistent application, and we hope this article was a step in unlocking the full potential of Root Cause Analysis for your organization.
Reliability runs initiatives such as an online learning center focused on the proprietary PROACT® RCA methodology and EasyRCA.com software. For additional resources, visit EasyRCA Resources.


Related Topics:
Ready to Get Started?
Getting started with EasyRCA is straightforward. We begin with a conversation to understand your current RCA process, then move forward only if it makes sense.
1
Connect with an RCA Advisor
Have a short, no-pressure conversation about how you currently handle RCAs.
2
Talk through your current RCA process and challenges
We focus on your tools, workflows, constraints, and where RCA slows down or breaks down.
3
Move into a tailored demo or pilot if it makes sense
If EasyRCA is a fit, we move forward. If not, you still leave with clarity on your RCA process.
No generic demos. No forced trials.
