EasyRCA Knowledge Base
Access EasyRCA's Learning Hub for Proven Strategies
Optimize Workflow, Foster Collaboration, and Enhance Reliability.Tutorial Videos
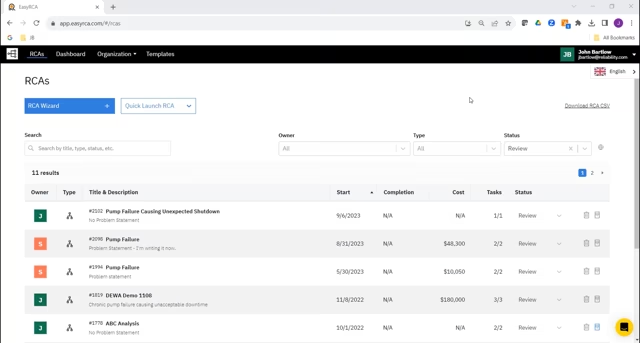
1. RCA Main Page
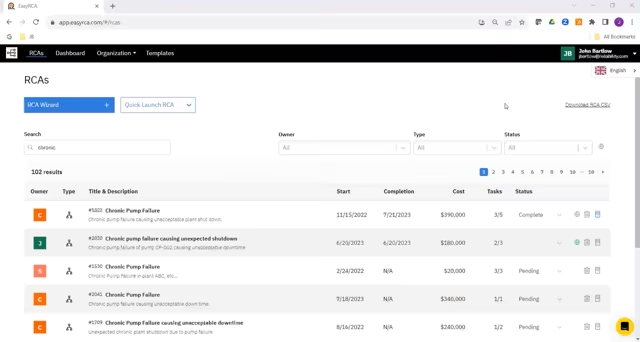
2. Create a New RCA
3. Building the Cause and Effect Analysis Tree
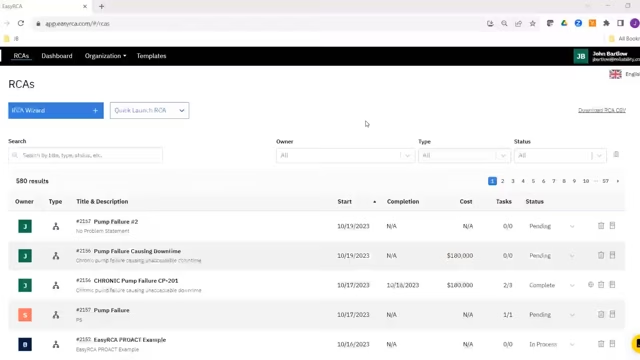
4. Add Team Members to an RCA
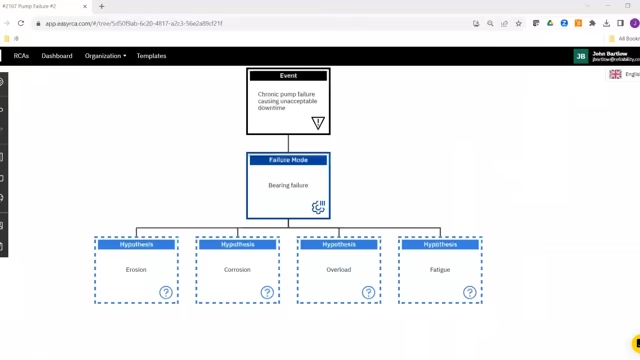
5. Assign Tasks to Team Members
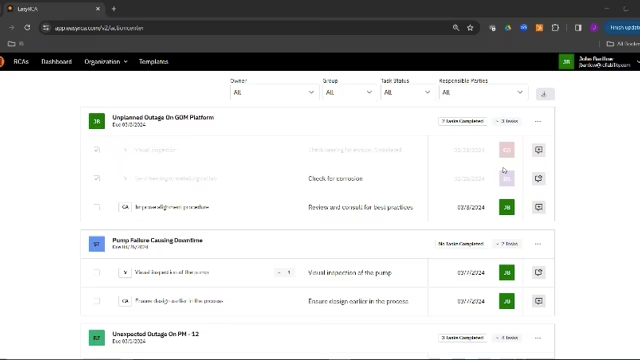
6. Manage Tasks Using the Action Center
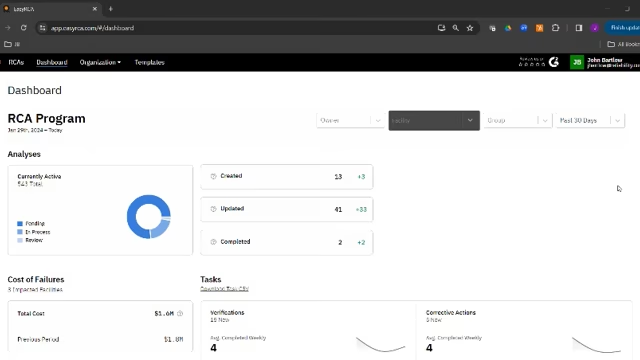
7. Using the EasyRCA Dashboard
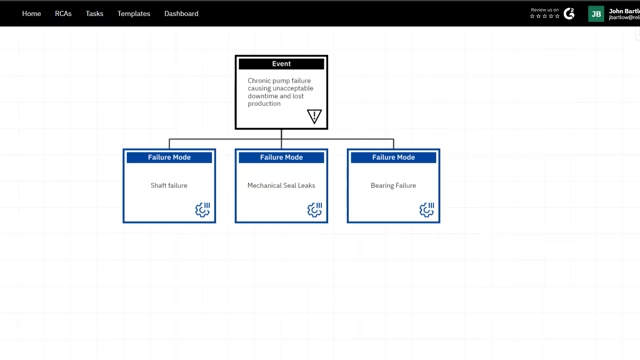
8. AI Features
FAQs: Your Quick Answers to Common Questions
Eliminate roadblocks and maximize your efficiency with our EasyRCA FAQs. Find quick solutions, tips, and tricks to supercharge your RCA process.Featured FAQs

Administration
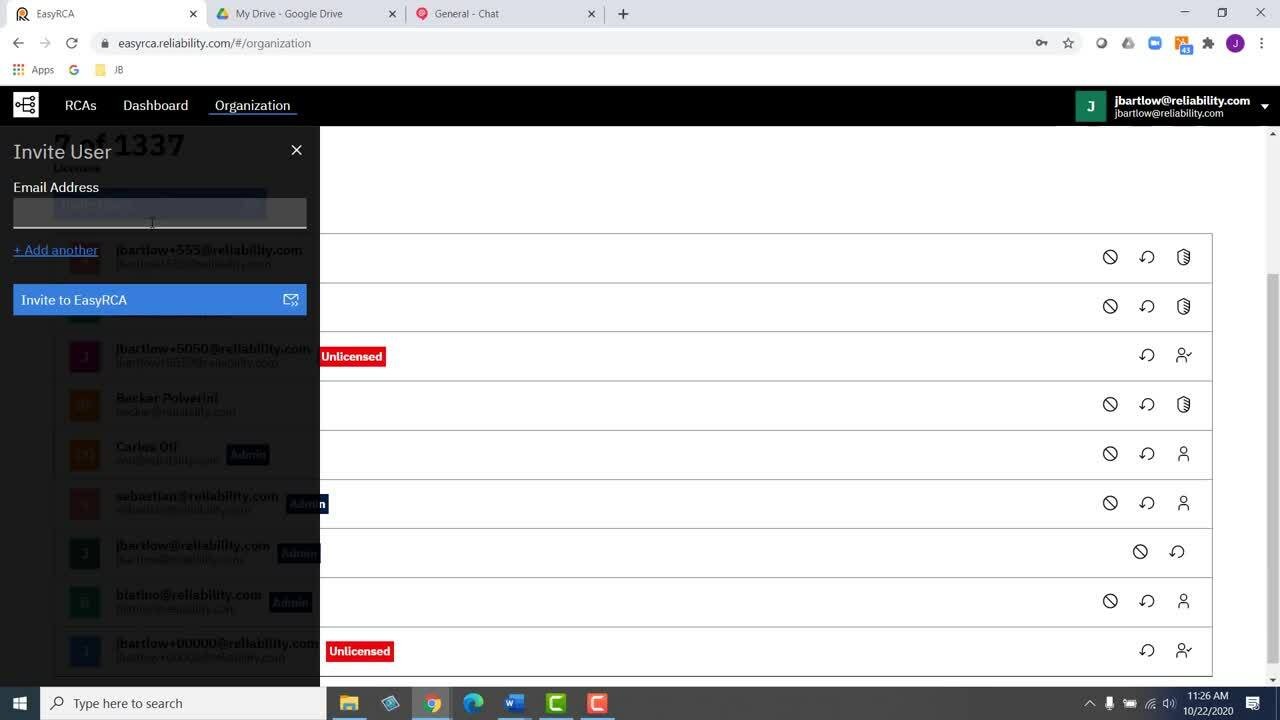
Only an Account Administrator has permission to invite users to EasyRCA. An Administrator may invite users up to the number of EasyRCA licenses purchased.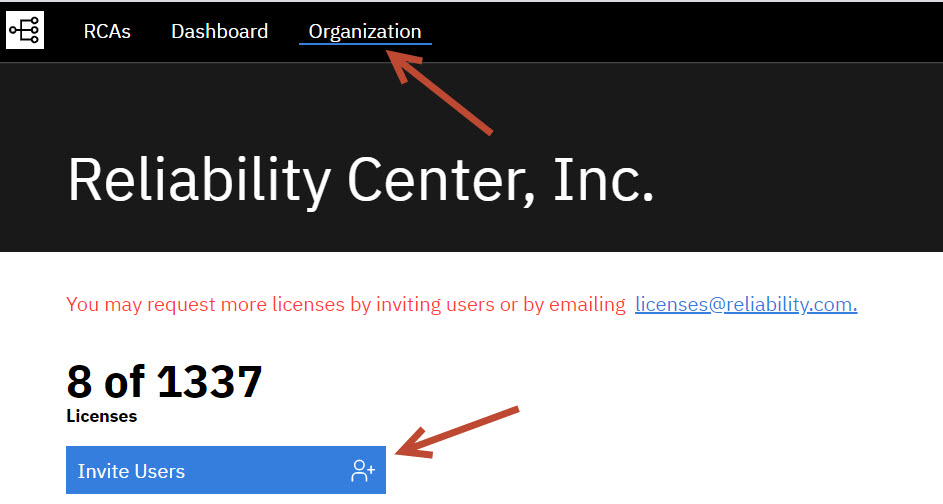
In the Organization tab an Administrator can grant or remove a license from a user, assign Administrative rights and send a password reset email.

In the Organization tab, click the circular arrow icon to the right of the user's name.

- Cybersecurity Compliance
- ISO 27001, 27017, 27018 platform provider
- SOC 1, 2, and 3 platform provider
- HIPAA-compliant platform provider (req. upgrade to Enterprise)
- Encrypted-at-rest data storage
- A+ TLS rating, encrypted-in-transit
- Data stored in the United States
EasyRCA has 4 User Roles: Organization (Org) Admin, Group Admin, User, Task Assignee
- The Organization Admin has permission to see and edit all analyses in the system. The Org Admin may invite new users to the account, assign/remove licenses, assign Admin privileges, send password reset emails & create Groups and assign Group Admins. There can be more than 1 Org Admin.
- A Group Admin is designated by the Org Admin when setting up Groups. The Group Admin will automatically see all analyses any user in his/her Group creates. The Group Admin may add or remove people from the Group.
- A User is the default user type in EasyRCA. A User may create, edit & delete unlimited analyses. A User will only see analyses he/she created or analyses he/she is named a team member on. NOTE: If a User would like to keep an analysis ‘confidential’ they should not add anyone to the analysis team. Then only the User, a Group Admin (if applicable) and the Org Admin will have permission to see the analysis.
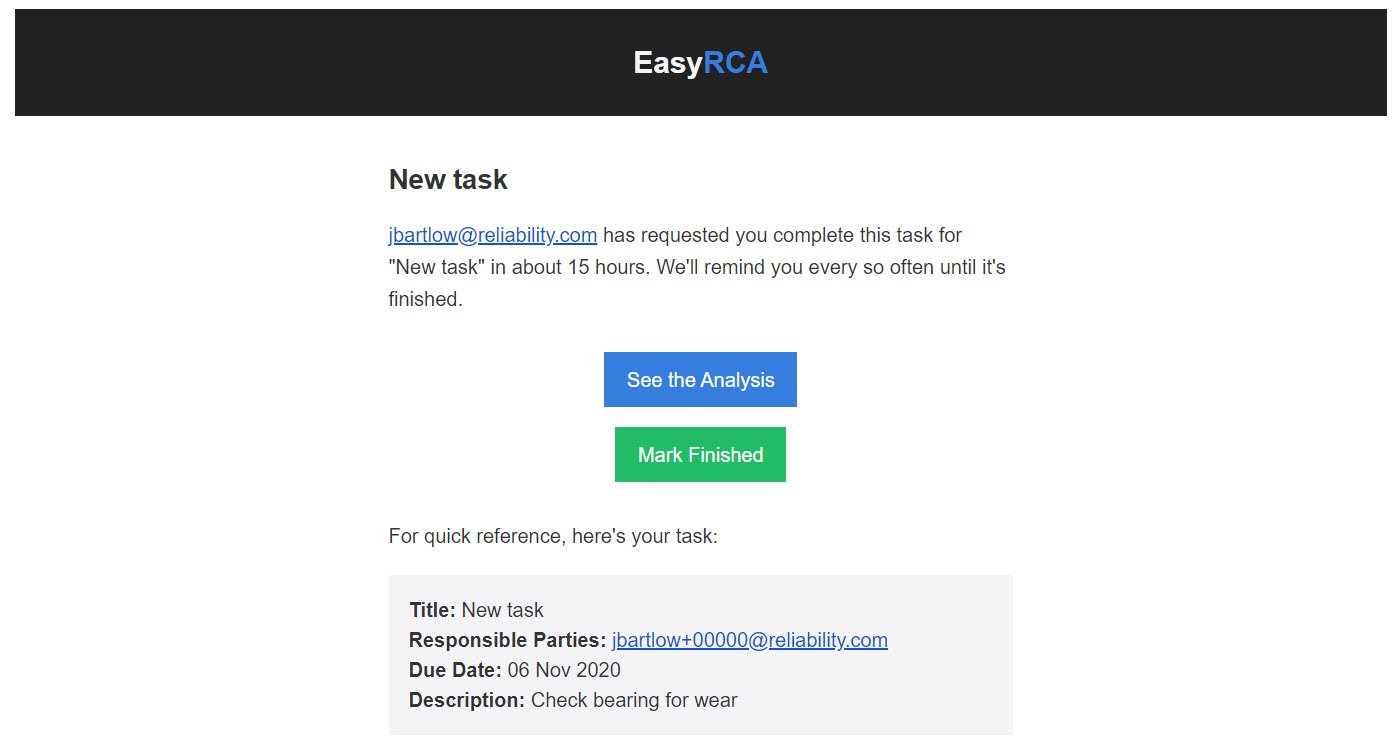
- A Task Assignee can be anyone you assign a task to. You may simply type in any email address in the ‘Responsible Parties’ field when creating a Task - this person does not need to be part of your EasyRCA account. They will receive an email with the task instructions which includes a link to view the tree and a button to mark the task ‘Complete.’ They do not have permissions to input any findings or upload documentation. This would have to be conveyed back to an EasyRCA User.
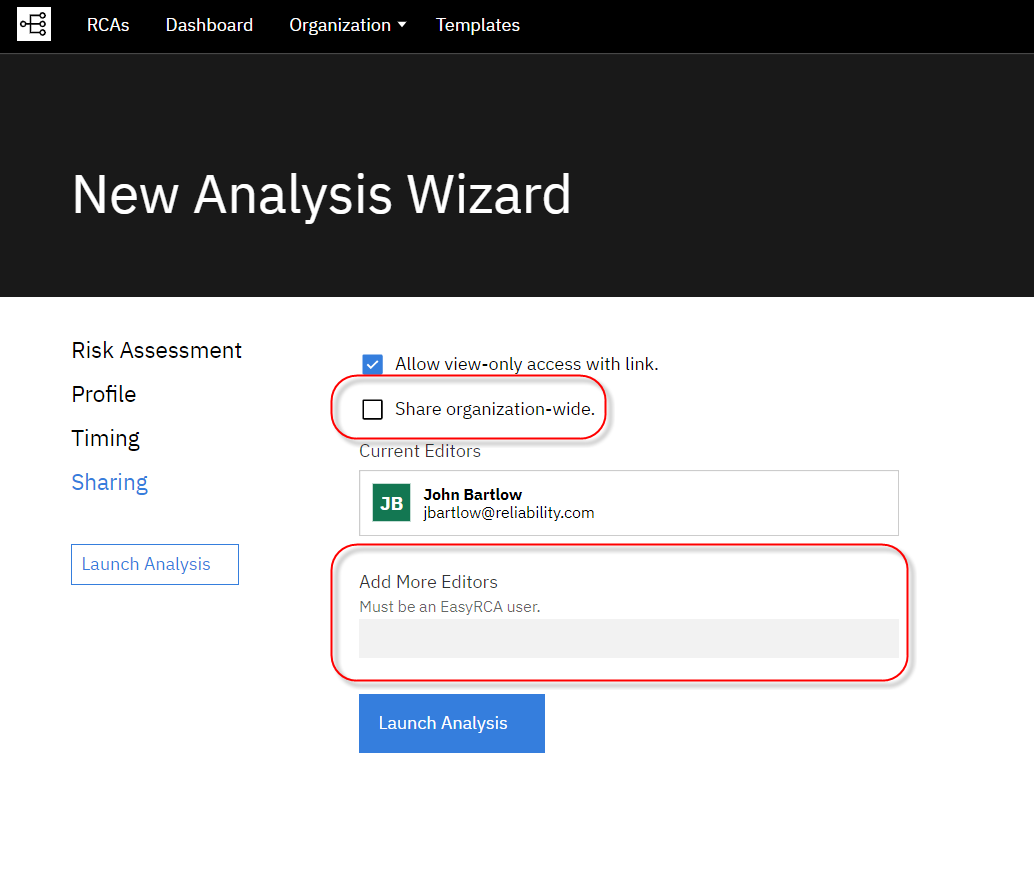
When creating a new analysis in the Sharing section of the RCA Wizard, you have control over who it is shared with
You may click a button to share with the entire Organization or you may add additional team members one-by-one
Contact [email protected] and we will assist you
Reporting
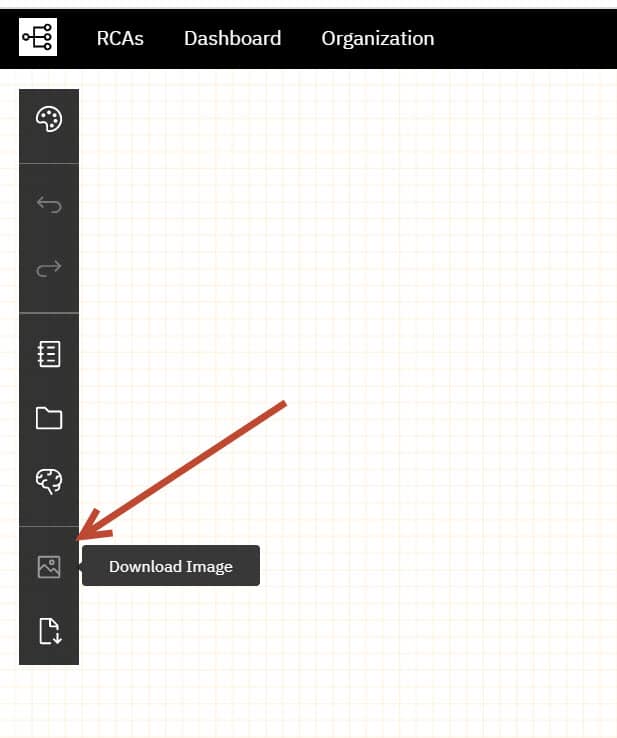
Click the Download Image button in the Analysis Toolbar. Your tree will download in PNG format.
Click the View Report button to view your report.
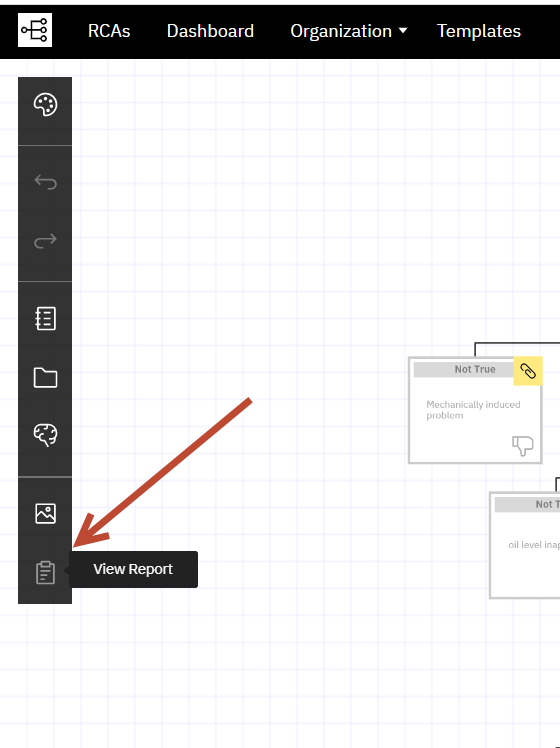
You can share the URL for this page with others in your organization
OR
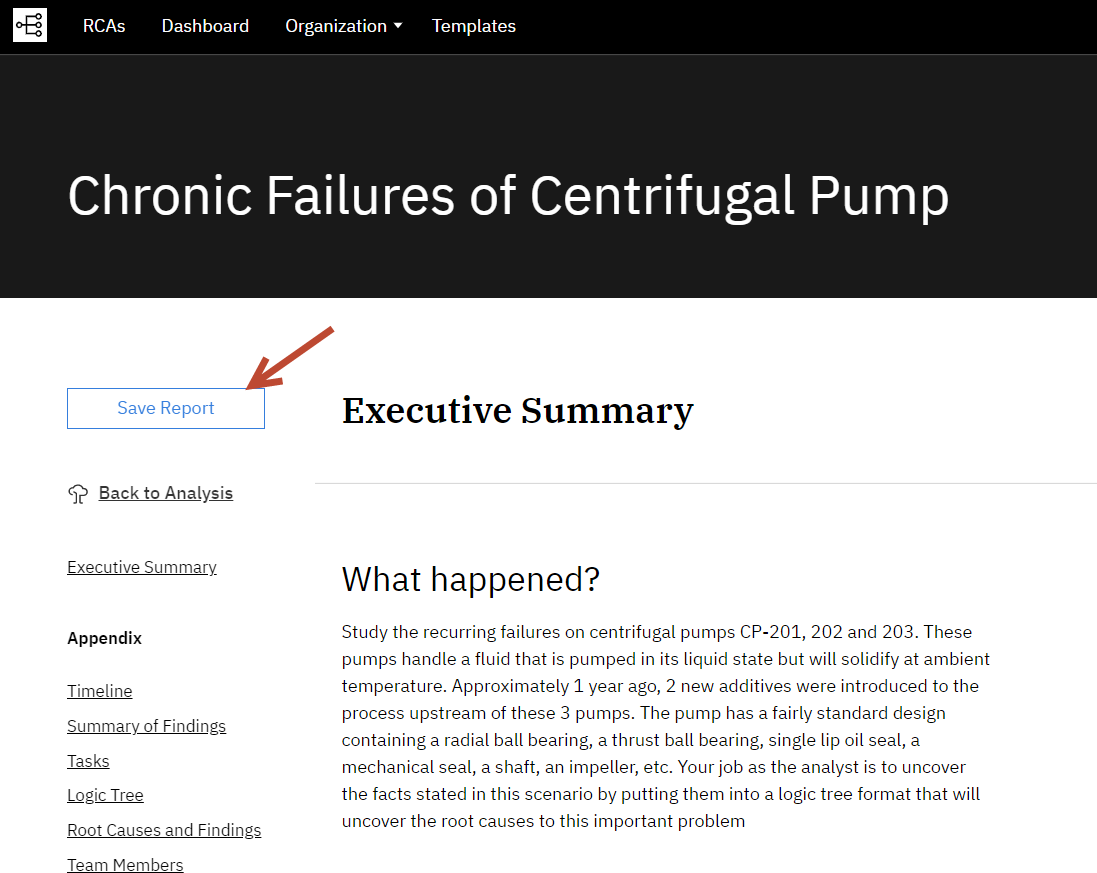
if you prefer to download your report for sharing, just click Save Report.
- Go to “Organization” > “Settings” in the top navigation.
- Click the “Webhook” tab on the top right.
- Get a Webhook URL by clicking the “Create” link.
- Click the “Copy” link to copy the URL to your clipboard.
- Paste the URL into Power Query’s Web API (for more information on Power Query, see Microsoft’s support documentation listed here)
- Follow the Webhook prompts to import, analyze, and chart your data.
Helpful Videos
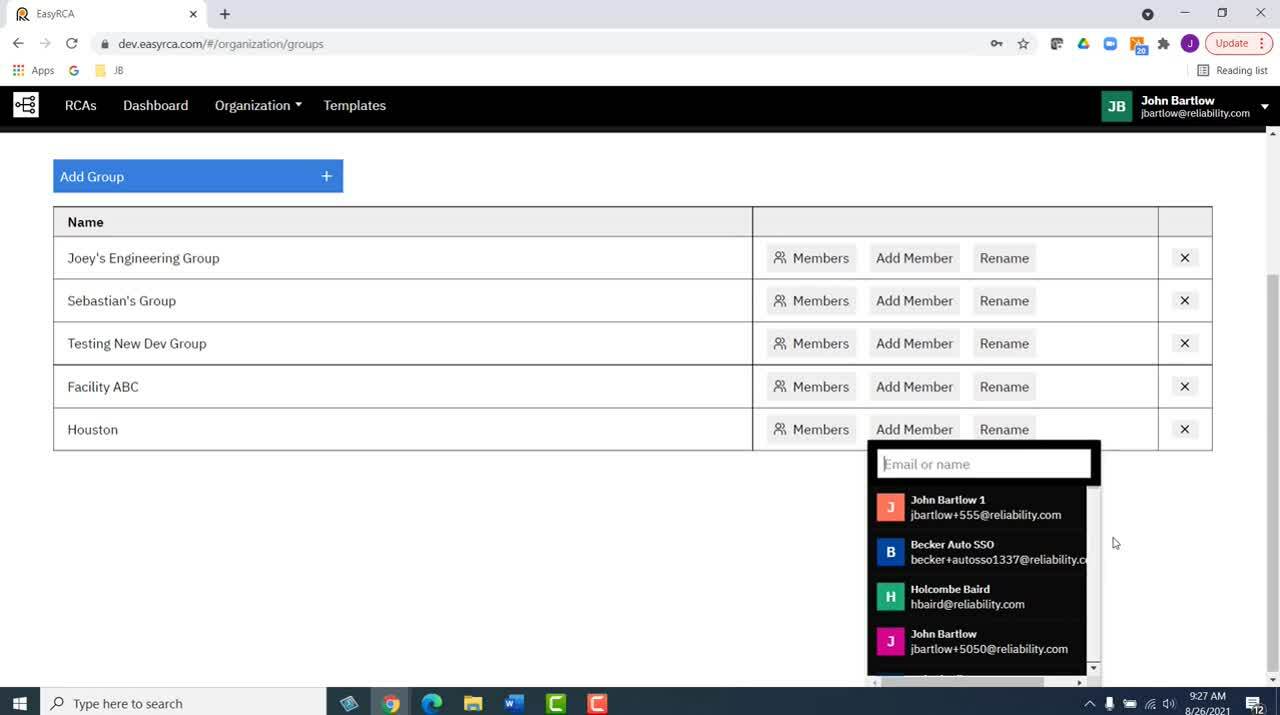
Create and manage Groups in the Organization tab. First of all, what are Groups? Groups are any grouping of people that work together on RCA's. This is often a team of people at a particular location, but it does not have to be. An Organization Administrator may create a new group and assign any user in the Organization to that Group. The Org Admin will also designate an Administrator for that Group. Then, the Group Administrator will have permissions to manage his or her group. The Group Administrator will automatically see any RCA's created by members of his or her Group.
Working in the RCA Module
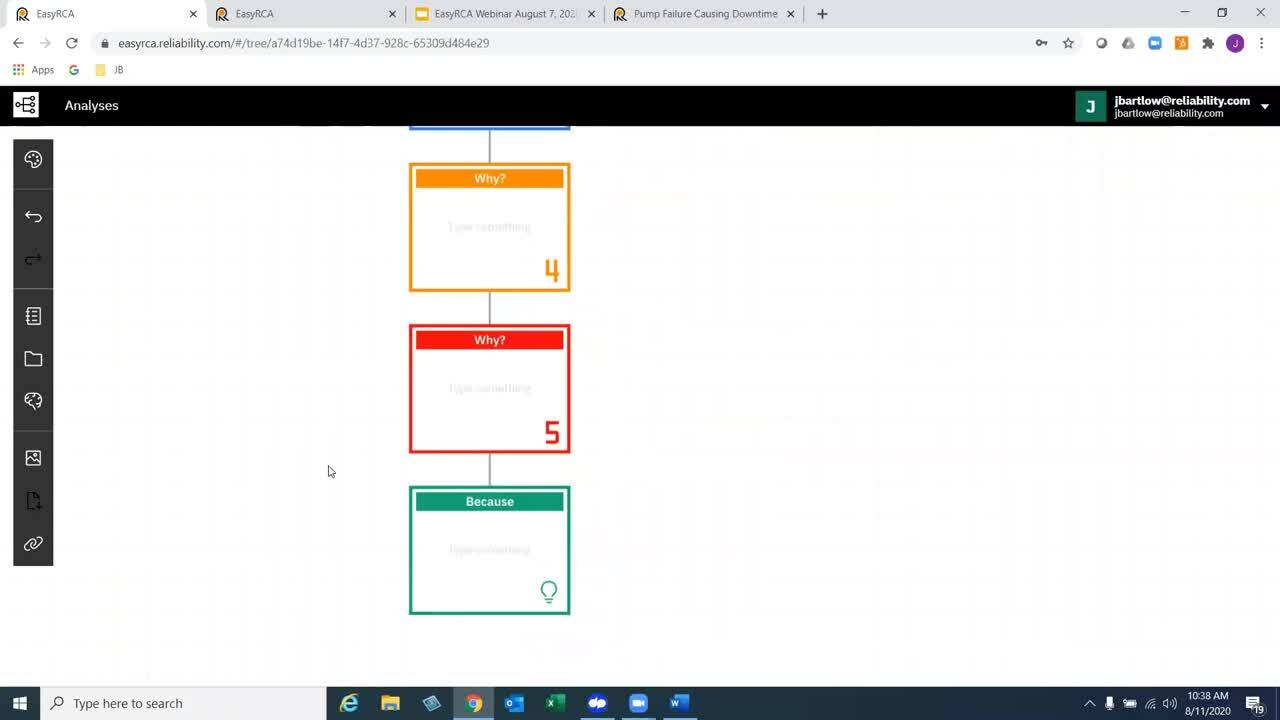
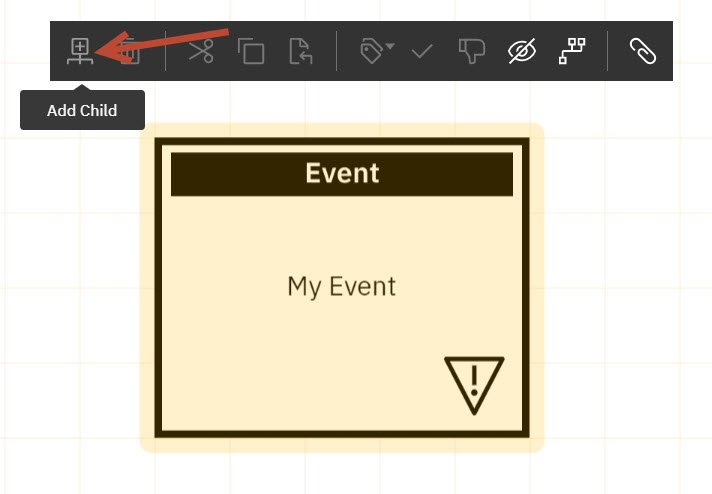
To begin adding blocks to your tree, click the Event to enable the node toolbar. Then click the button on the far left of the toolbar to Add a Child.
You can continue adding blocks (nodes) to the tree in this manner. Alternatively, when you are entering text into a node and you would like to add a child beneath you, simply hit the Enter key to add a child.
If you would like to add another node on the same level, once you are finished entering text and the cursor is still active, simply hit the Tab key.
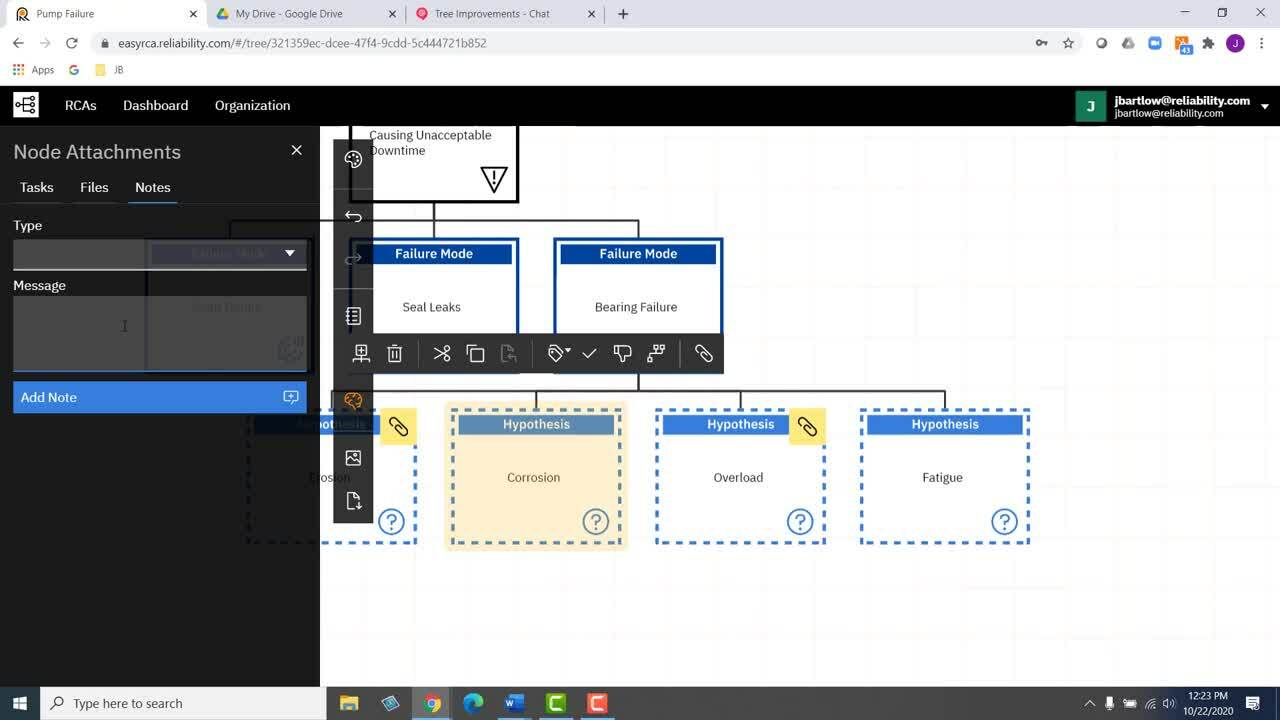
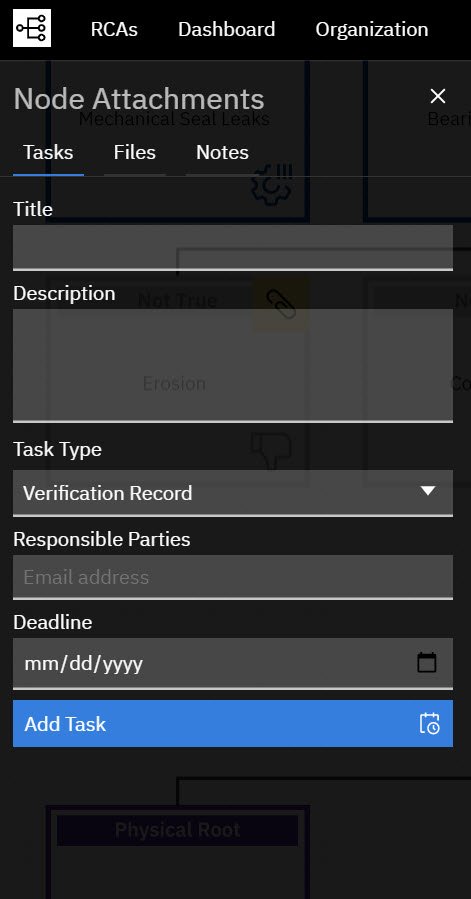
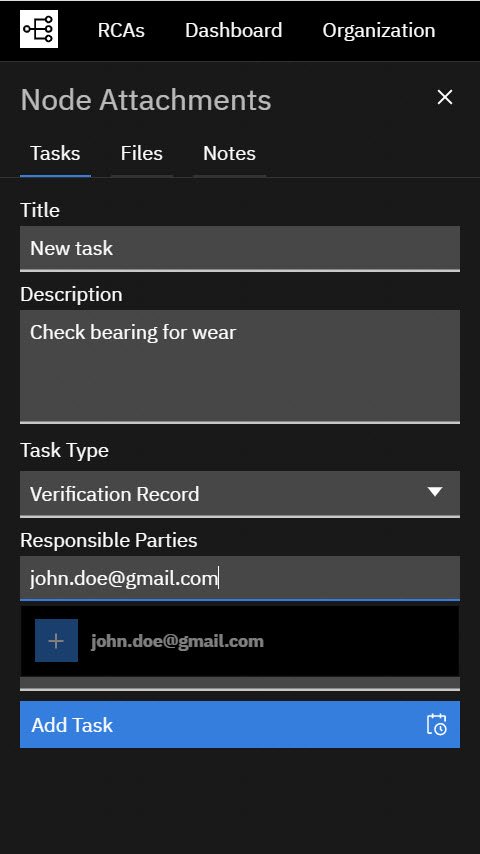
You can easily create tasks in the logic tree by clicking the paper clip icon on the Node Toolbar for any node on the tree.
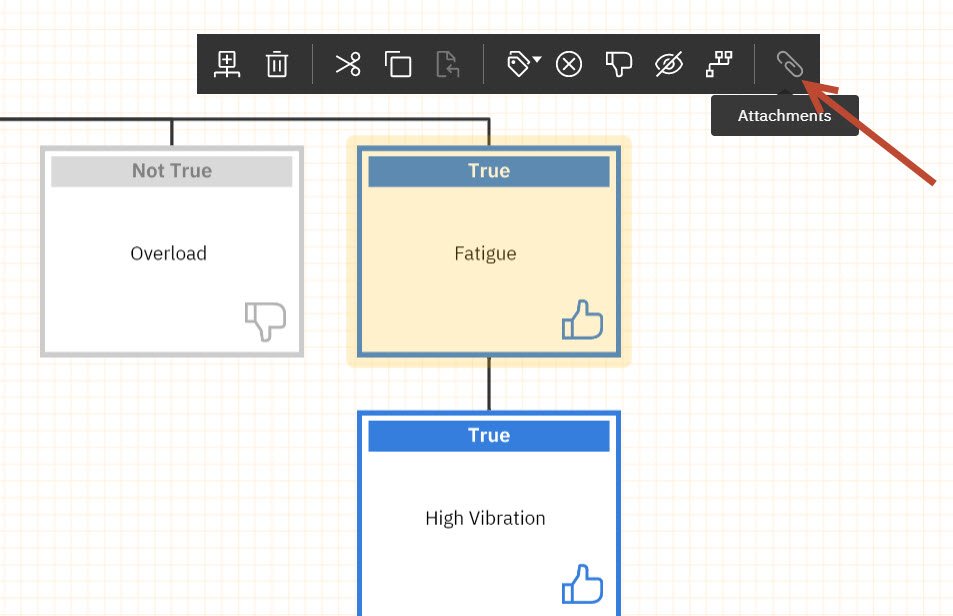
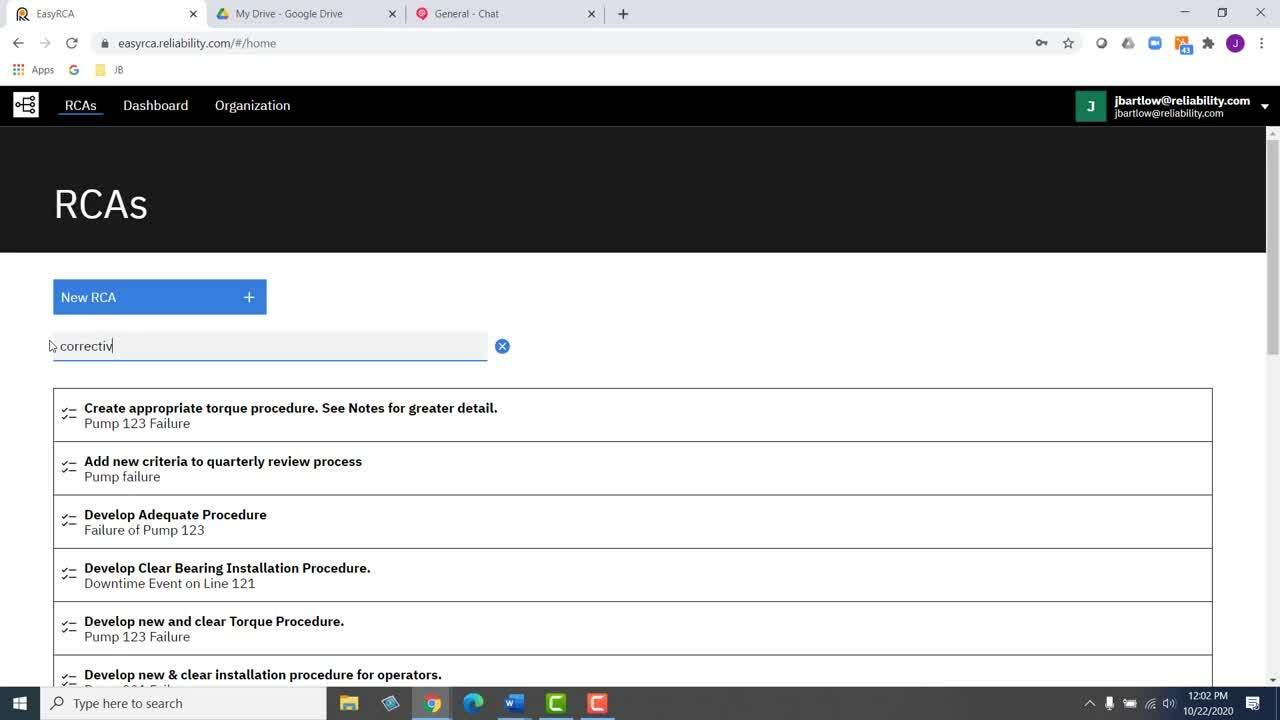
Then you will simply give your task a title, description, select a type (Verification Record or Corrective Action), assign it to a team member and enter a deadline. When you are done, click 'Add Task'
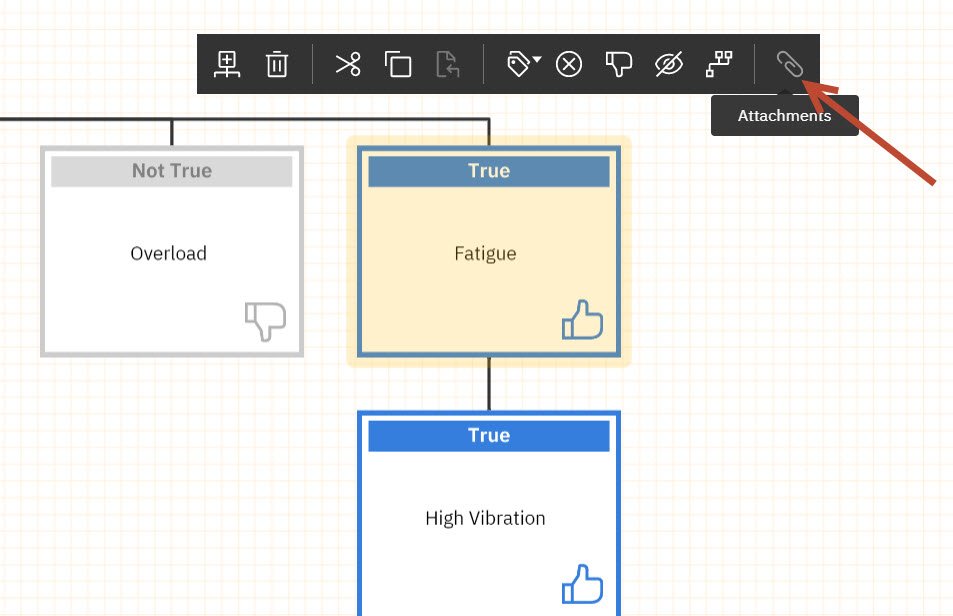
Click the Attachments (Paperclip) button on the node toolbar for any node you would like to upload a file to.
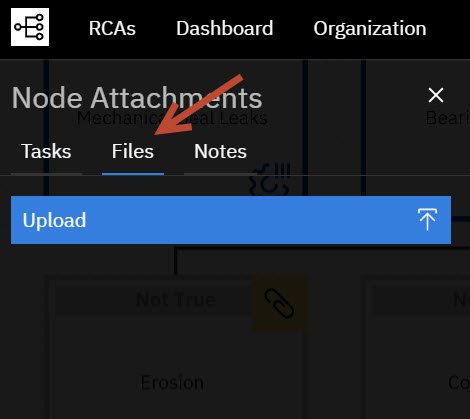
Select the Files Tab and click the blue Upload button to browse for the file you would like to upload.
You have already set up your analysis and you would like to go back and edit some of the information such as, title, description, team members, costs, etc.
This is done using the Analysis Toolbar on the left of the screen. Click the Event Information button.
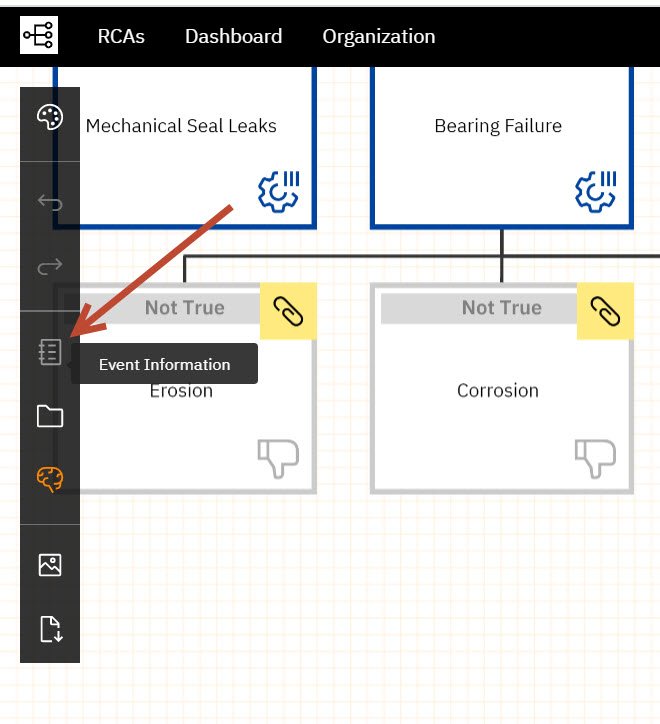
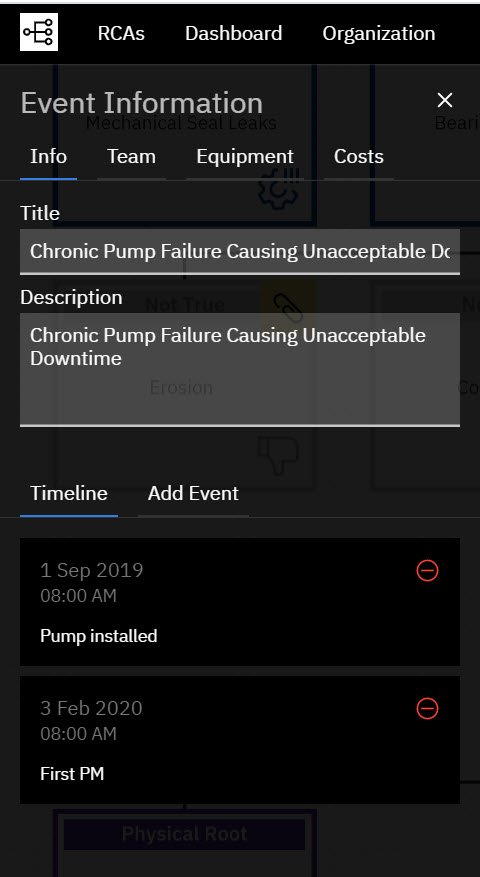
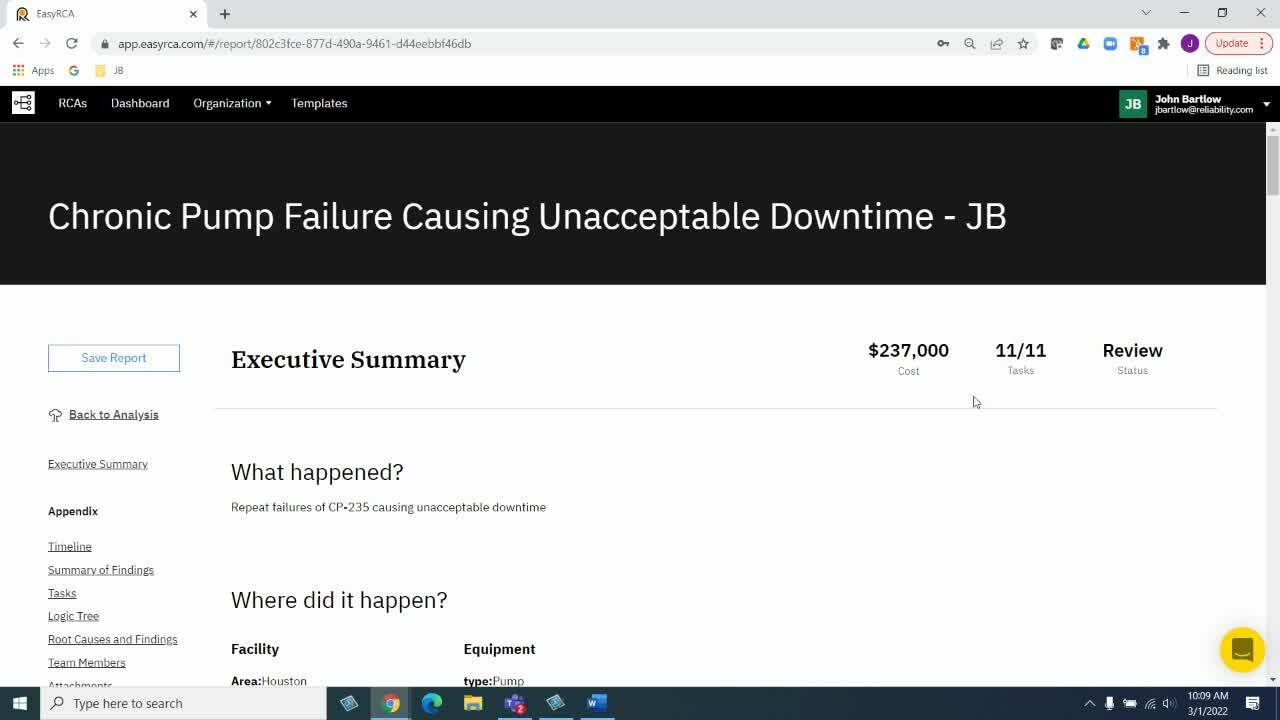
You can create a timeline in Event Information.
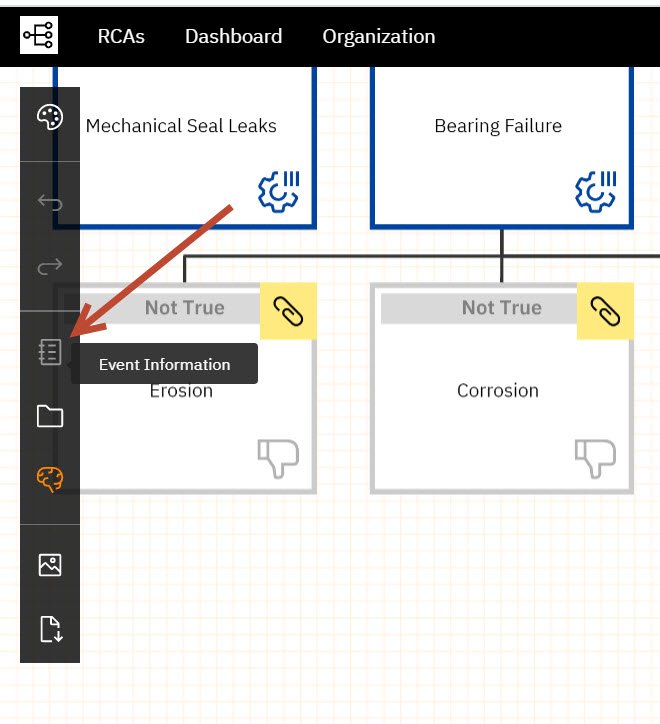
This is done using the Analysis Toolbar on the left of the screen. Click the Event Information button.
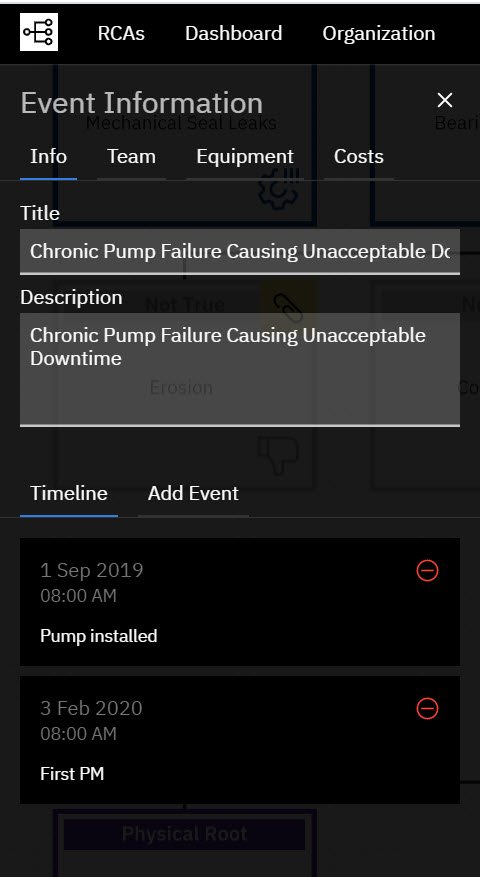
In the lower portion of the blade simply click 'Add Event' to start adding entries to your timeline.
Simply open the analysis you would like to share and copy the URL in your browser and send it to anyone you would like to share it with.
Any LICENSED user you added to the Analysis team during setup will have access to the tree and can work with you on it in real time. you will notice when others are in the analysis by their avatar showing up in the top right of the screen.

In Tasks, simply type in the email of the person you would like to assign the task to. they do not need to have a license.
The assignee will receive an email alerting them to the task assignment. They can view the tree and mark the task complete from within the email they receive.
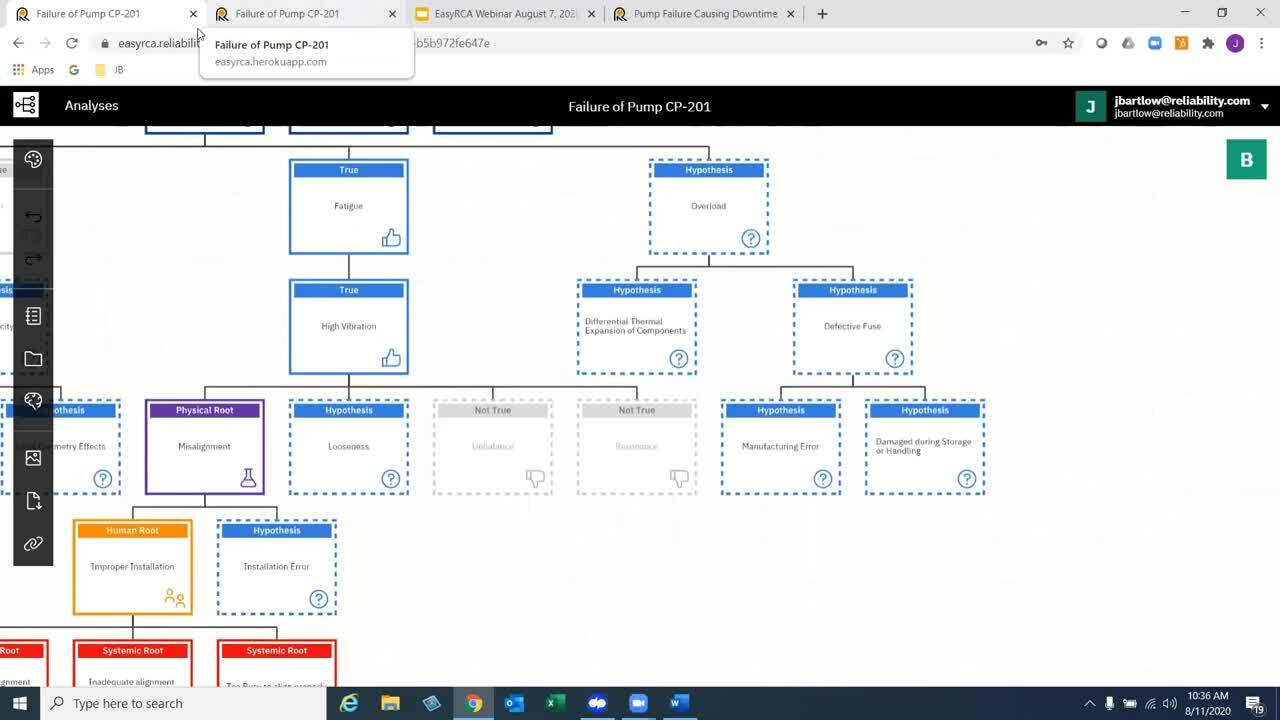
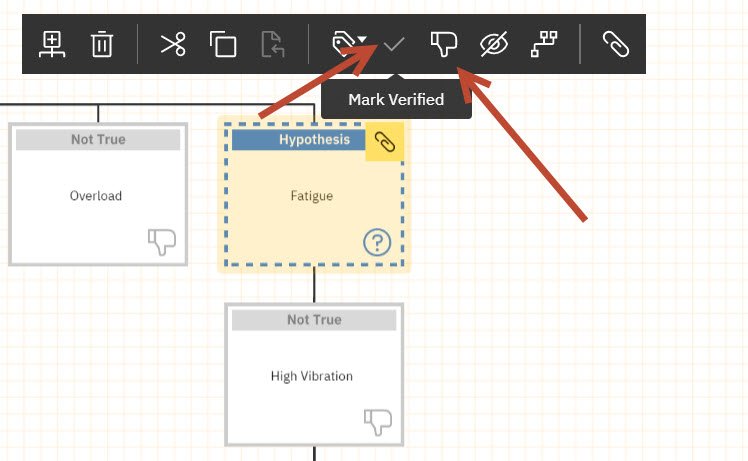
You can label hypotheses as true, not true, as root causes, contributing factors or corrective actions. This is done using the Node Toolbar. Hover your mouse over any icon and a tooltip will guide you.
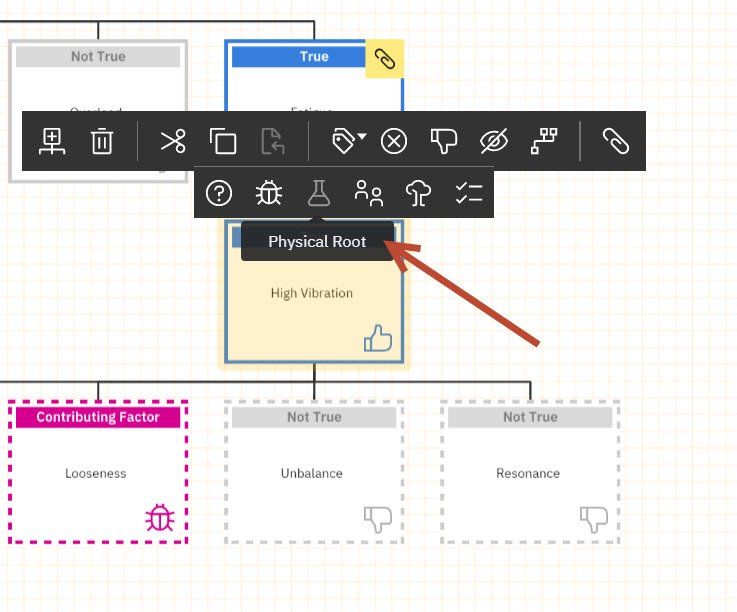
The Thumbs Down icon will mark a hypothesis Not True. To verify that it is supported with evidence, click the check mark.
To verify a hypothesis as True, simply click the check mark.
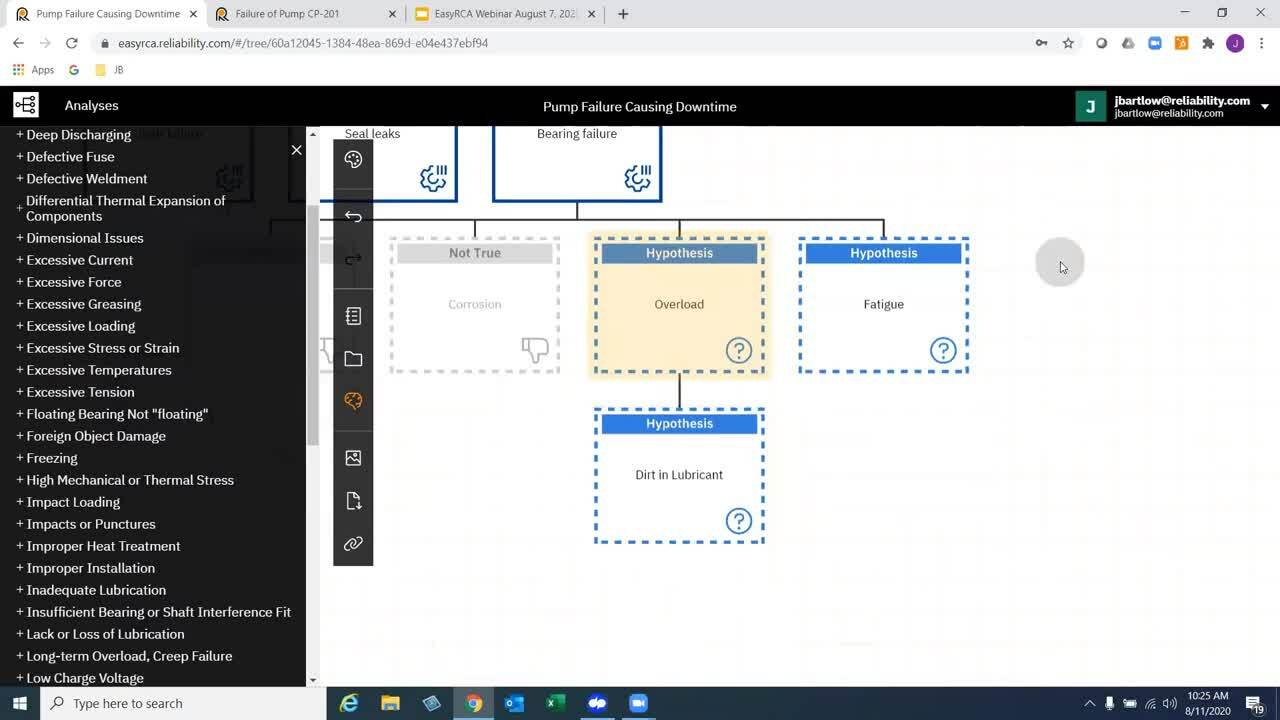
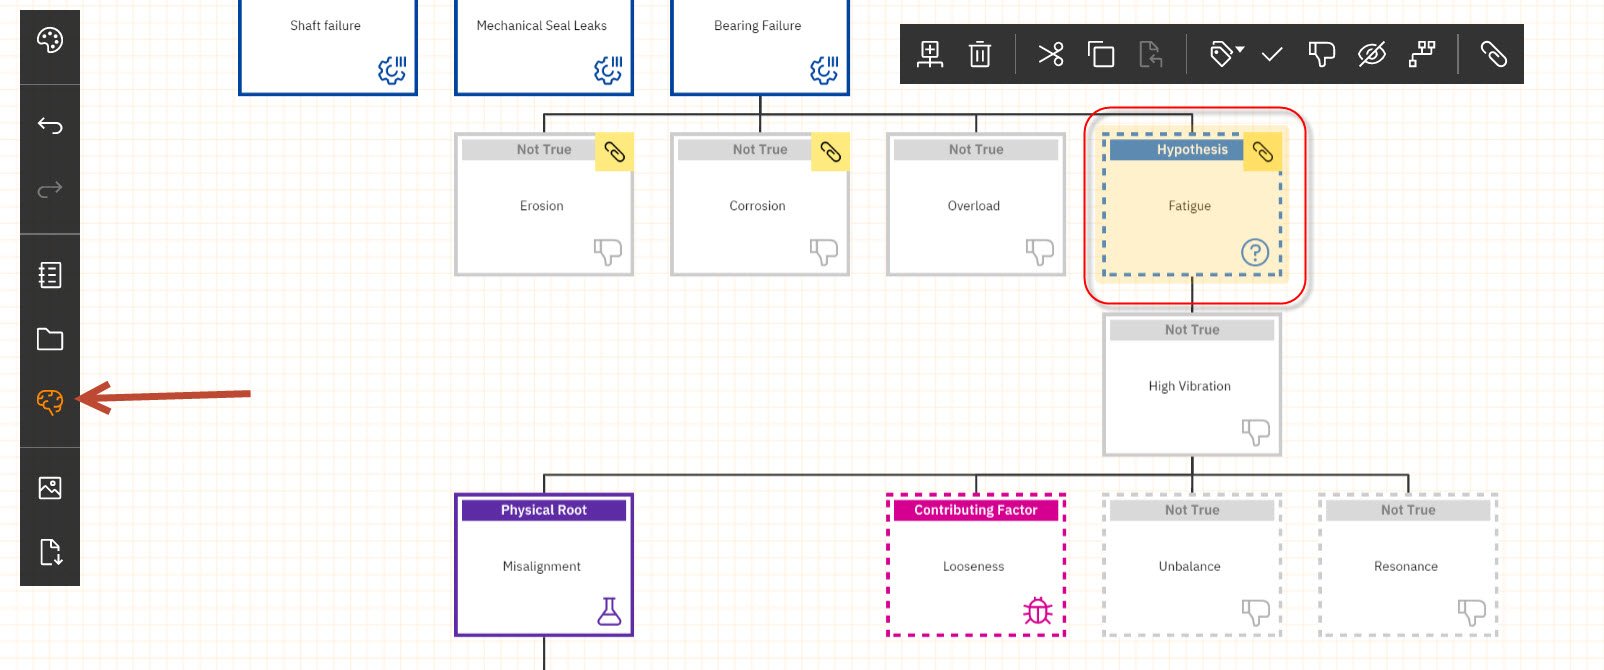
When you have a node on the tree selected, the Analysis Assistant icon on the Analysis Toolbar on the left of the screen will light up in red if there is cause and effect data available to help you based on the text in the selected node.
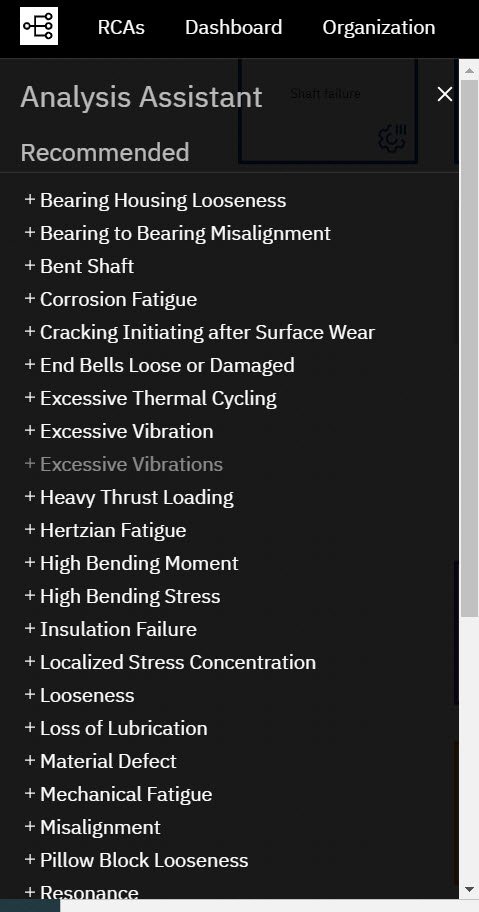
For example, in the image below Fatigue is selected and the Analysis Assistant is providing a list of possible causes for fatigue.
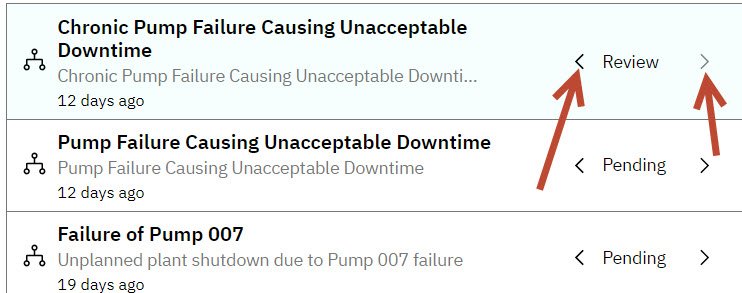
Changing the status of an analysis is very simple. Simply click the arrows next to the status to toggle through the status options and choose the appropriate one.
On the Analysis toolbar on the left, click the View Attachments button.
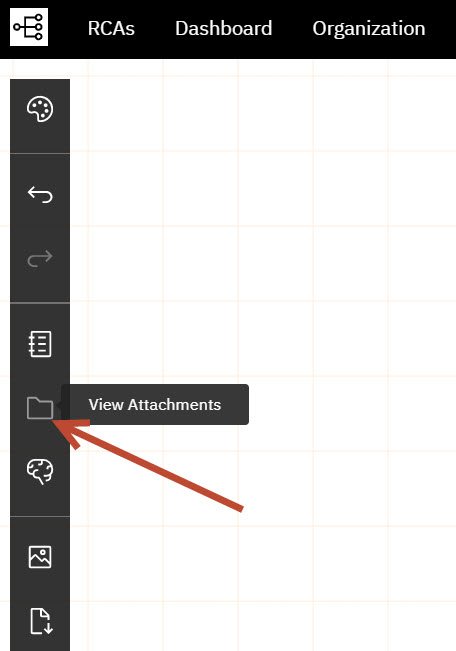
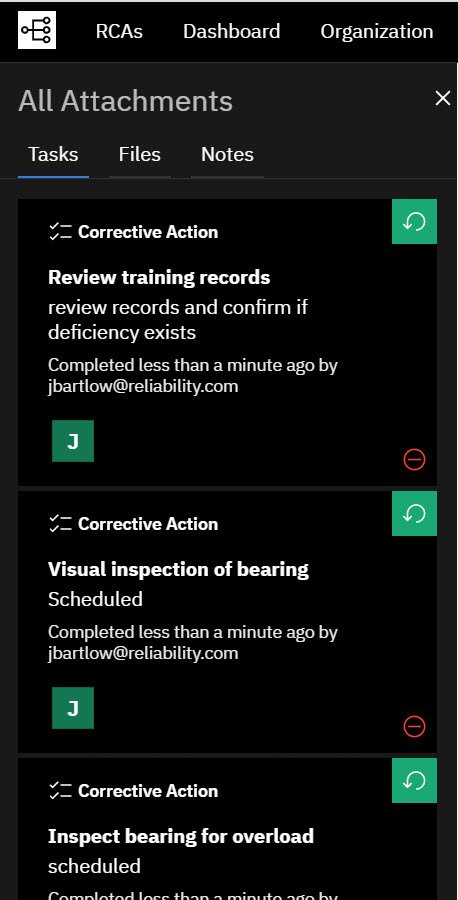
This will give you a listing of all of the tasks, notes and files for this analysis. When you mouse over any of the items in the list, the corresponding node on the tree will flash yellow to alert you which node the task or note or file is related to.
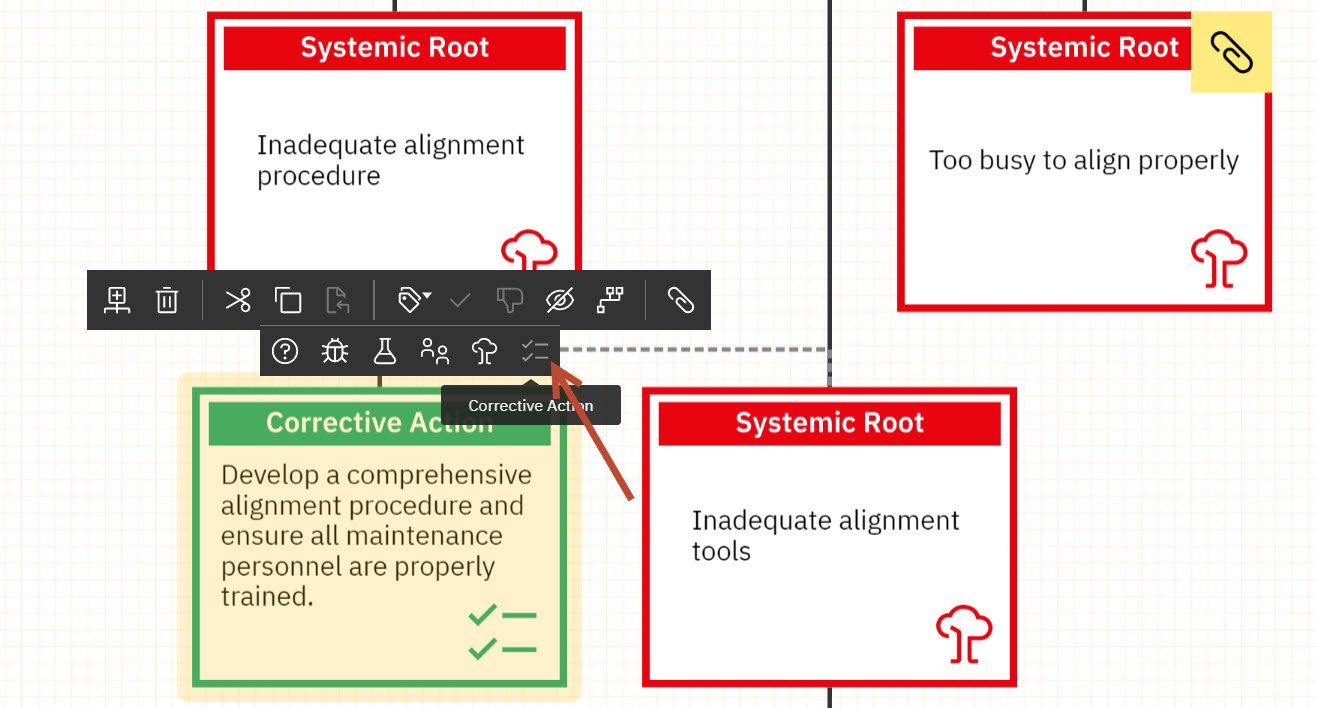
Yes. Simply add a block wherever on the tree you would like to add a corrective action (typically beneath a root cause). Then you can label the node as a Corrective Action.
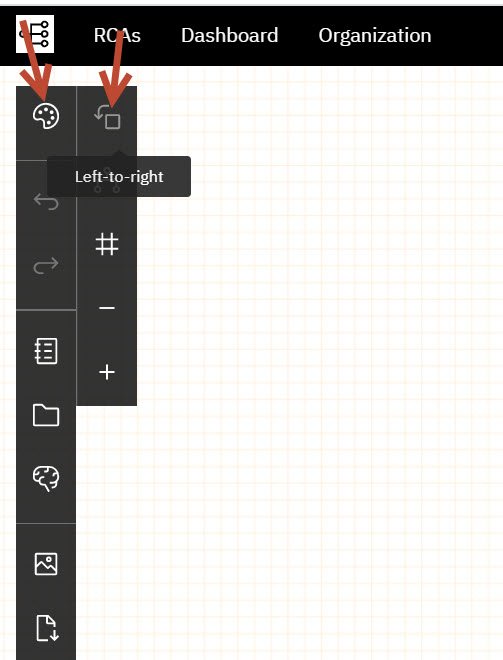
Yes. On the Analysis toolbar on the left of the screen click the Palette button to access the Appearance options tools. Then click the top button for 'Left-to-Right'
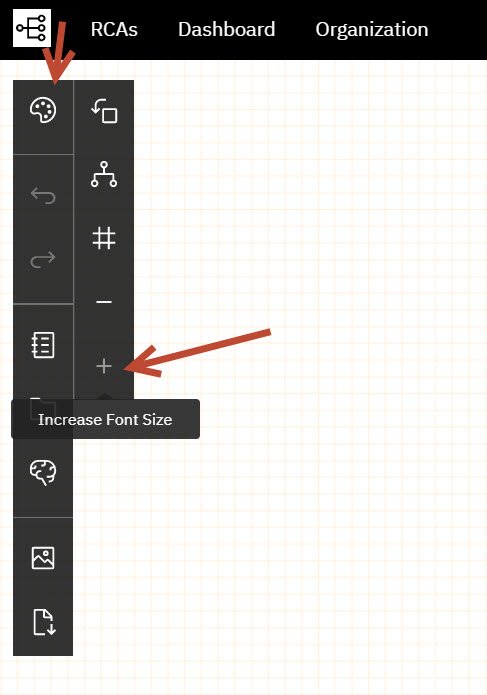
Yes. Click the Palette on the Analysis Toolbar and you may use the plus and minus signs to adjust the font size in your tree.
Yes. On the Node Toolbar, click the Hide button. this will hide that node and all children beneath it.
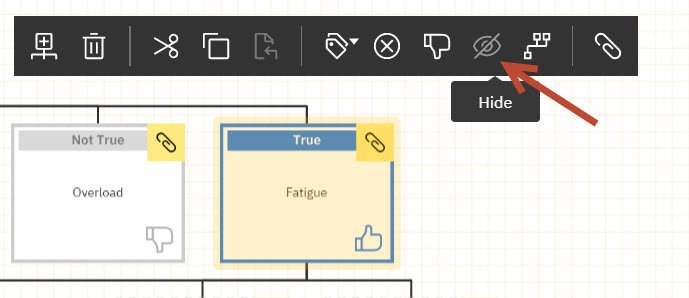
To have the hidden portion of the tree reappear simply click the Hide button again.

Yes. To do this you can use the Connect feature. Simply click the Connect button and then click the other node you would like to associate the root cause with.
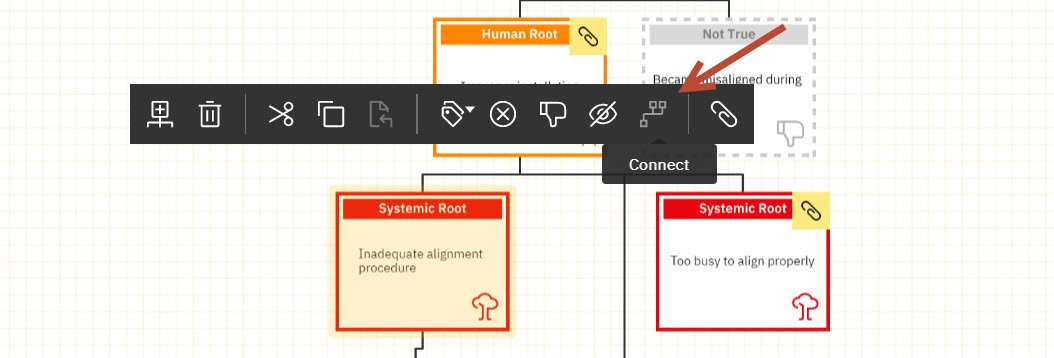
A dotted connecting line will connect your root cause to the desired node elsewhere in the tree.
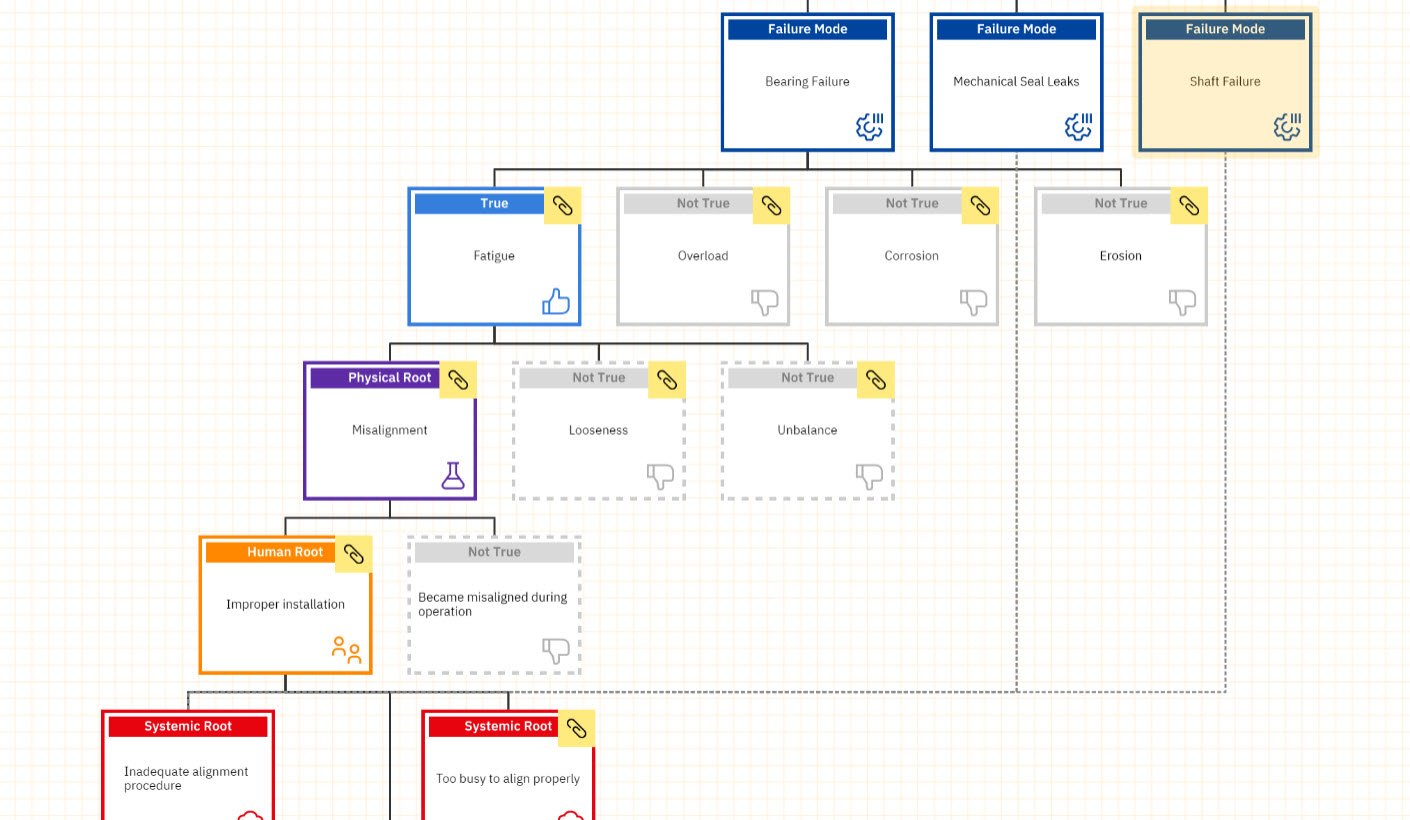
To remove the connecting line, simply click on the line itself.
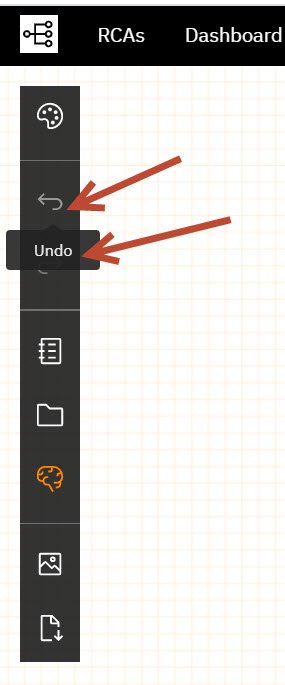
Yes. On the Analysis toolbar, there are undo and redo buttons.
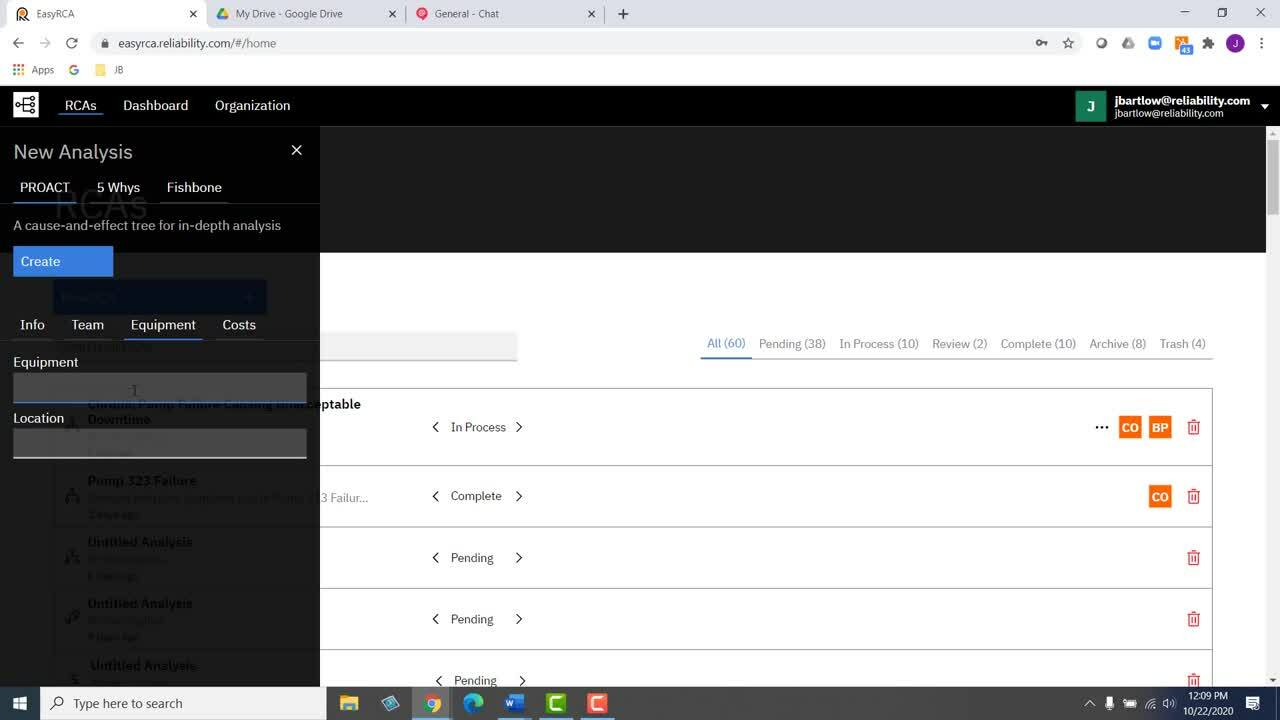
On the homepage, click New RCA. then select either 5-Why or Fishbone.
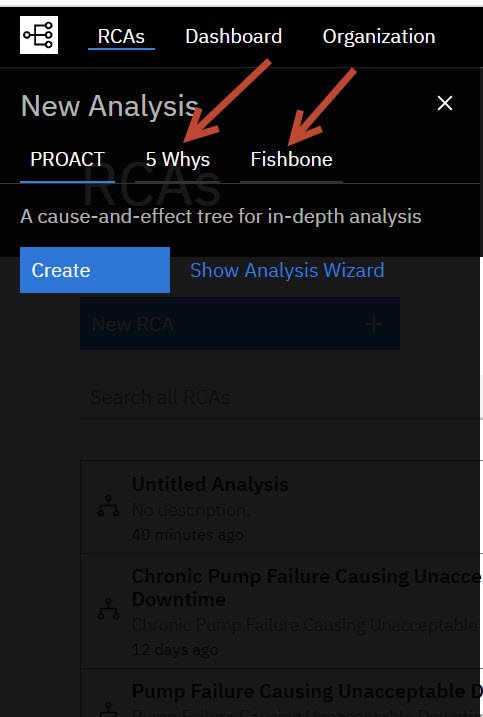
Then click Create!
Confidence for each node is set by the "Thumbs Up/Down" and the 'Check Mark' icons on the ToolTips bar
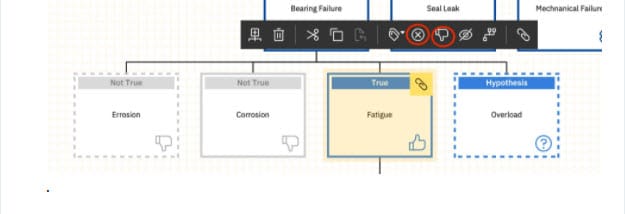
- True (Thumbs up + Check Mark)
- Possibly True (Thumbs up)
- Possibly False (Thumbs down)
- False (Thumbs down + Check Mark)
The EasyRCA Dashboard allows you to track the progress of your RCA’s and your RCA program as a whole. First of all, the Dashboard is scoped to the permission level of the logged in user, (e.g. A ‘User’ will see data associated with analyses he or she created and analyses in which they are a team member). An Organization Administrator will see data associated with all analyses in the Organization. A Group Administrator will see data associated with all analyses in their Group.
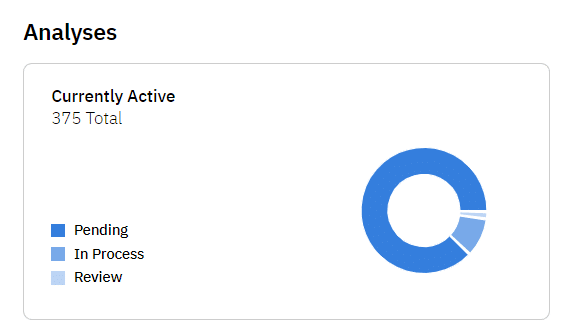
Total Active Analyses - these are all analyses which are still in progress (not in a ‘Complete’ status). This chart is the total for all time and does not change when time period or other filters are applied to the Dashboard.
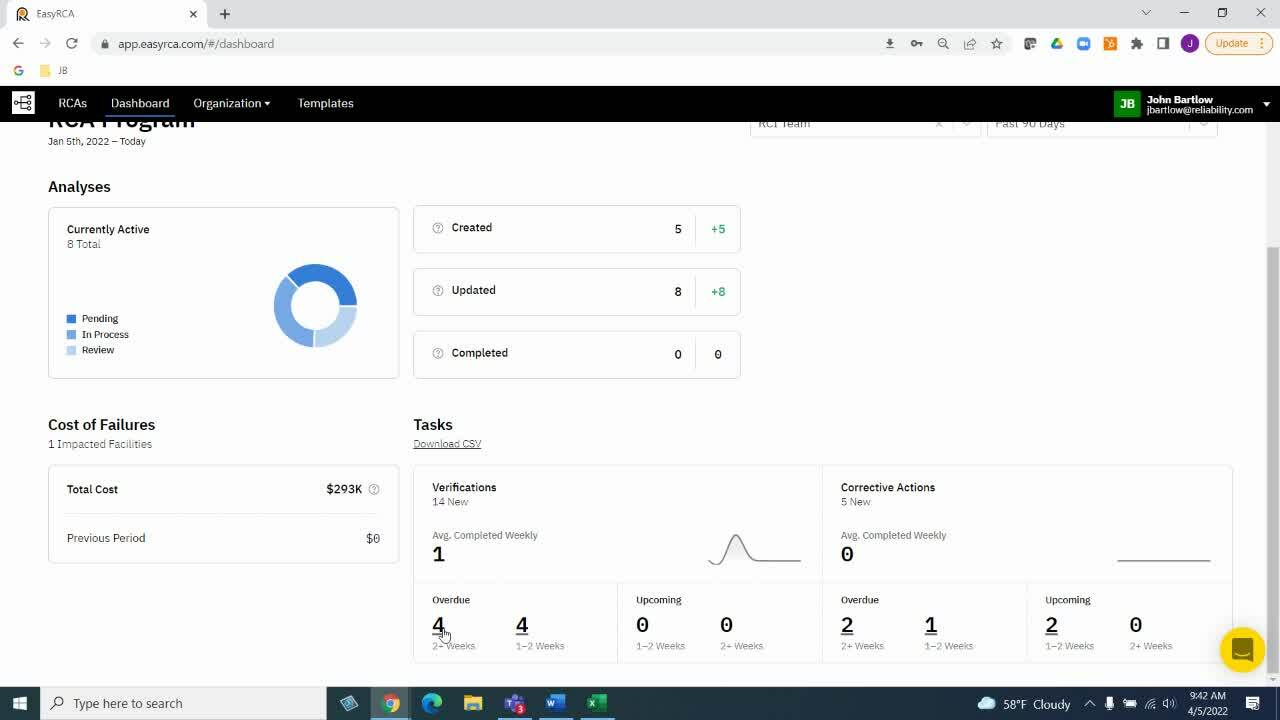
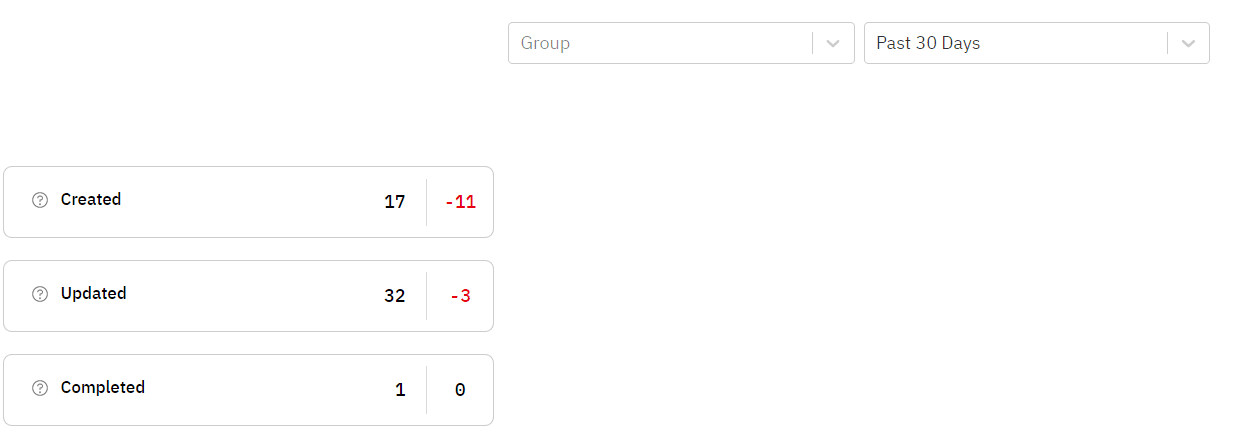
This shows the number of analyses created, updated and completed within the selected time period. This will also adjust for any other filters selected. In the image below, 17 analyses were created in the past 30 days. The red number is indicating this is 11 fewer analyses than were created in the prior 30-day period.
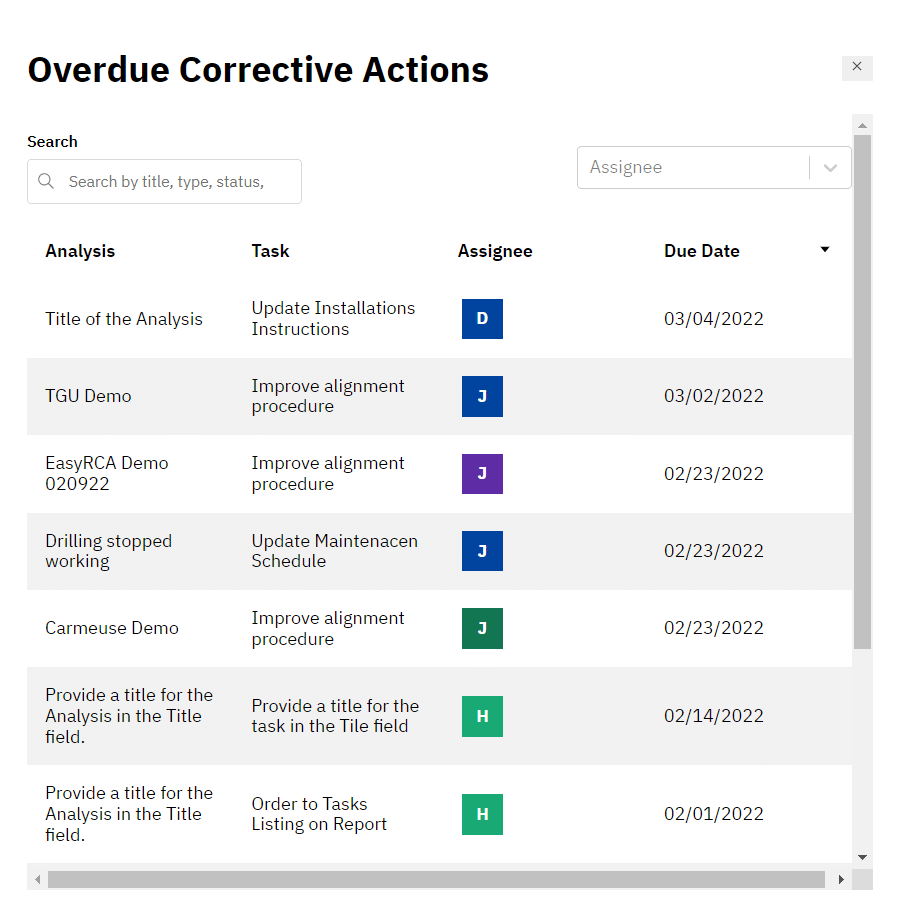
The Verification Tasks and Corrective Action Tasks respond to the filters chosen and provide details on how many tasks are upcoming or overdue. You may click on any of the number values to see the details.

When an analysis is put into a ‘Published’ status, it is available for your entire organization to view in a read-only format. This is helpful to share lessons learned and best practices across your organization.
You must be the Owner of the analysis or an Administrator in order to Publish an analysis. The analysis must be put into ‘Complete’ status before publishing.
To Publish an analysis, simply place the analysis into ‘Complete’ status, and a Globe icon will appear. Click the Globe icon and it will turn green. Your analysis is now Published.

The controls on the RCAs list page are:
- Change Status
- Publish
- Delete
- Add to Template Library
You must be the Analysis Owner or an Administrator in order to access these controls.

FAQs
Ignite your curiosity, subscribe now!
Stay informed and connected with the latest updates by subscribing today!

