

With over two decades in business – spanning strategy consulting, tech startups and executive leadership – I am committed to helping your organization thrive.
At Reliability, we’re on a mission to help enhance strategic decision-making and operational excellence through the power of Root Cause Analysis, and I hope this article will be helpful!
Our goal is to help you better understand various applications of fishbone diagrams by offering insights and practical tips based on years of experience. Whether you’re new to doing RCAs or a seasoned pro, we trust this will be useful in your journey towards working hard and working smart.
———————
Fishbone diagrams, also known as Ishikawa or cause-and-effect diagrams, are a powerful root cause analysis tool utilized across various industries. These diagrams serve the purpose of visually mapping out the potential causes contributing to a specific problem or effect, making it easier to identify the root cause of issues.
Their function lies in providing a structured approach to problem-solving and facilitating in-depth analysis. Moreover, fishbone diagrams play a crucial role in quality defect prevention by enabling organizations to proactively address underlying causes before they escalate into significant issues.
3 Examples of Fishbone Diagram Applications
Fishbone diagrams have applications across various domains as they allow us to identify factors that lead to process breakdowns and defects. They help us improve processes by pinpointing root causes and preventing quality defects. Let’s explore some examples where fishbone diagrams play a crucial role in identifying root causes and preventing quality defects.
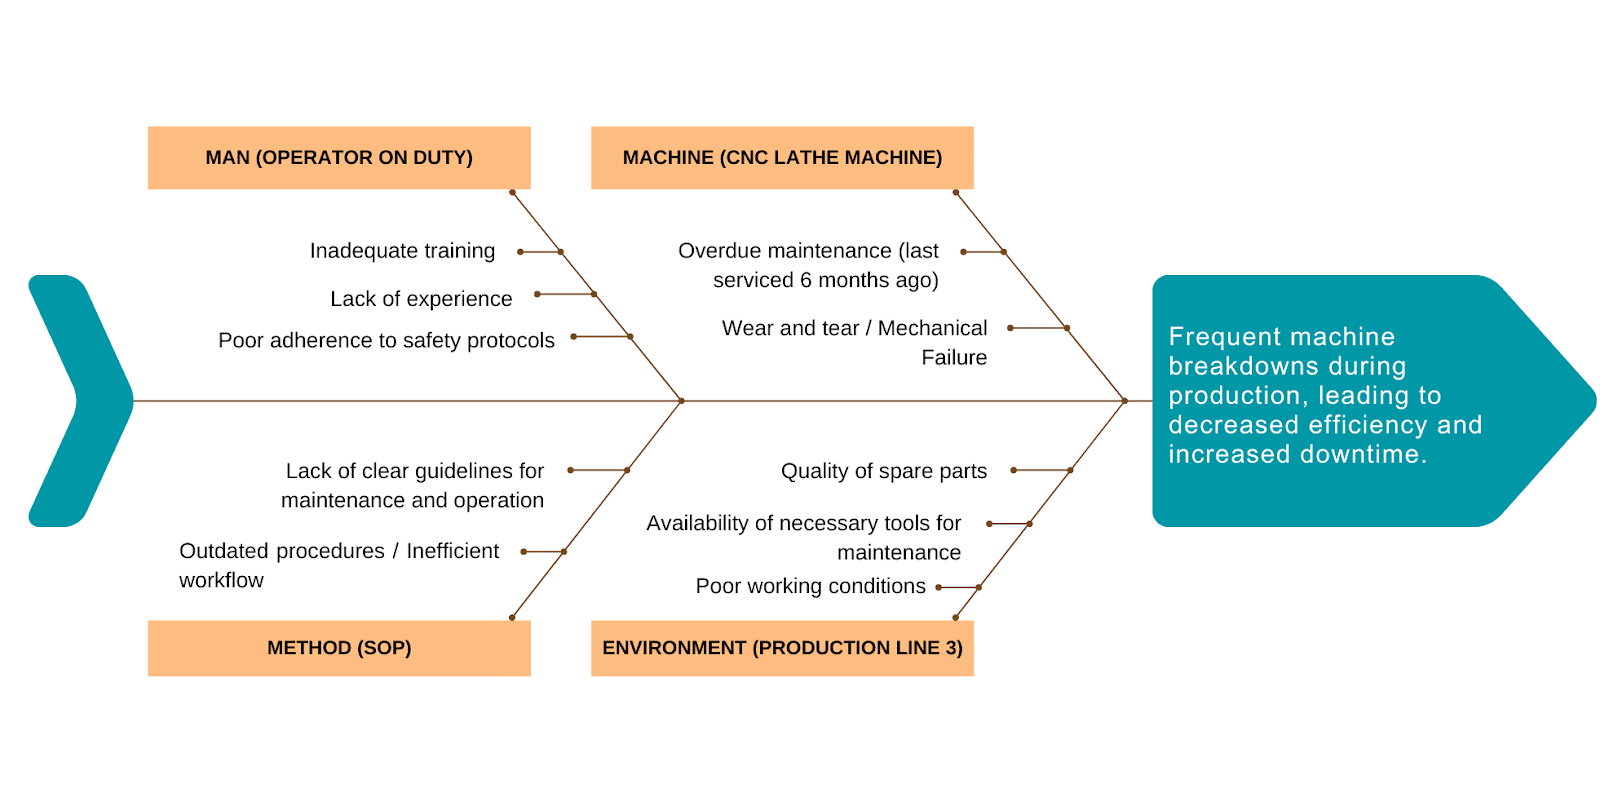
Example 1: Fishbone Diagram in Manufacturing – Machine Breakdown
In the manufacturing sector, fishbone diagrams are instrumental in detecting machine breakdown within production processes. By visually illustrating the potential causes of a machine breakdown, these diagrams aid in identifying production issues and preventing recurring problems.

Problem Statement: Frequent machine breakdowns during production, leading to decreased efficiency and increased downtime.
Facts gathered during the preliminary investigation:
- Time of breakdown: During the second shift
- Location of breakdown: Production Line 3
- Machine involved: CNC Lathe Machine
- Operator on duty: Recently trained employee
- Maintenance history: Last serviced 6 months ago, overdue for maintenance
With this information, the team used the fishbone diagram to better understand the causes of the machine breakdown. The root causes identified were:
- Inadequate training, lack of experience, and poor adherence to safety protocols by the operator handling the machine (Man)
- Overdue maintenance, wear and tear, and mechanical failure of the CNC Lathe Machine (Machine)
- Outdated standard operating procedures, inefficient workflow, and lack of clear guidelines for maintenance and operation (Method)
- Poor working conditions, inadequate lighting, and excessive noise or vibration in Production Line 3 (Environment)
By addressing these root causes, the manufacturing facility can prevent future breakdowns, improve machine reliability, and maintain production efficiency.
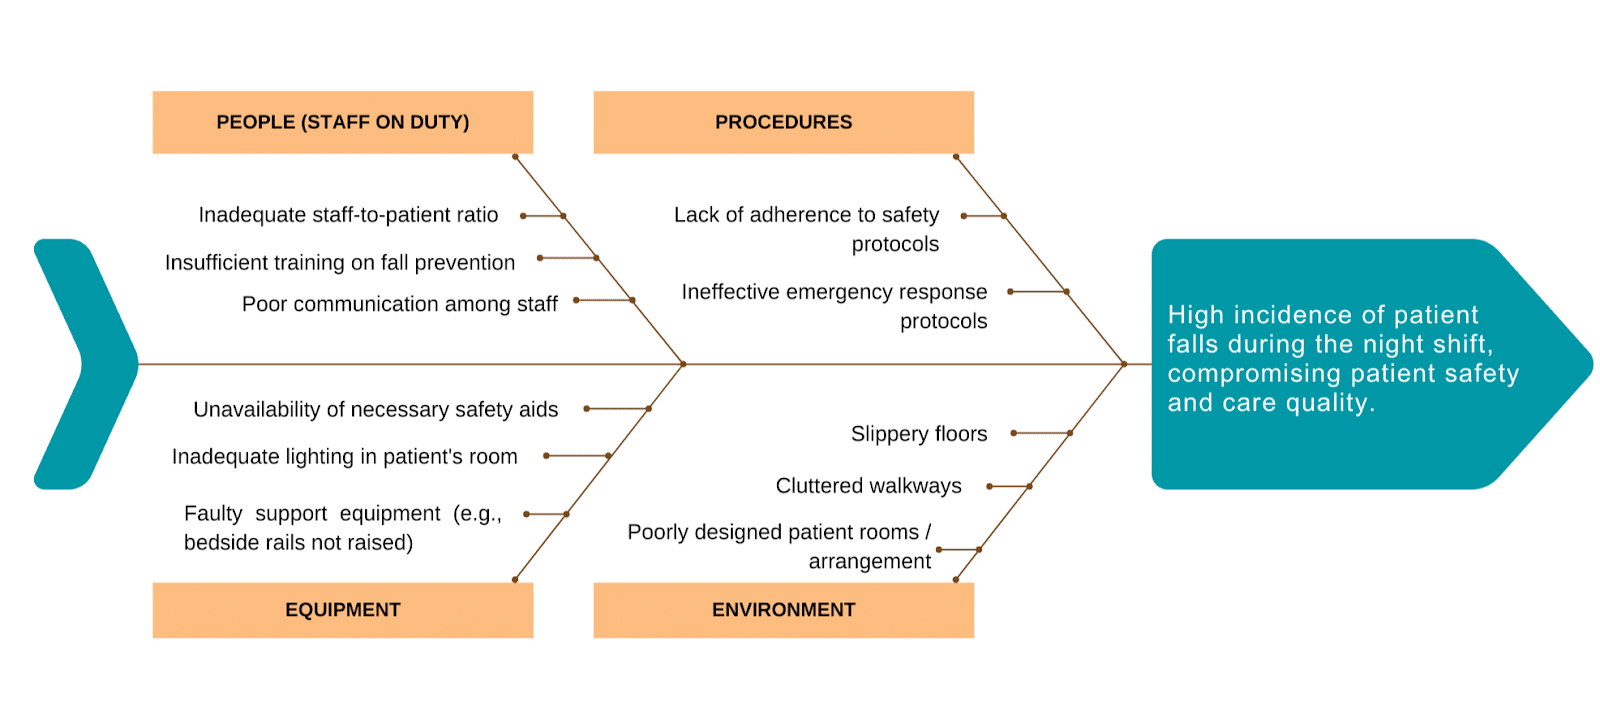
Example 2: Fishbone Diagram in Healthcare – Improving Patient Care
Within healthcare settings, fishbone diagrams are used to analyze the root causes of factors that diminish patient care, thereby contributing to improvements in caring for patients and enhancing overall healthcare quality. A patient falls in healthcare settings can lead to serious injuries and legal issues.

Problem Statement: High incidence of patient falls during the night shift, compromising patient safety and care quality.
Facts gathered during a preliminary investigation of a patient fall:
- Time of fall: During the night shift
- Location of fall: Patient’s room, near the bed
- Staff on duty: One nurse and one aide for the entire floor
- Equipment status: Bedside rails were not raised, and the call button was out of reach
- Patient condition: Elderly with a history of falls, on medication that affects balance
The fishbone diagram analysis revealed the following root causes:
- Inadequate staff-to-patient ratio, leading to insufficient monitoring (People)
- Lack of adherence to safety protocols, such as ensuring bedside rails are raised (Procedures)
- Inadequate lighting in the patient’s room, contributing to poor visibility (Environment)
- Insufficient assessment of the patient’s risk for falls and appropriate interventions (Patient)
By addressing these root causes, healthcare providers can improve patient safety, reduce the incidence of falls, and improve the overall quality of patient care.
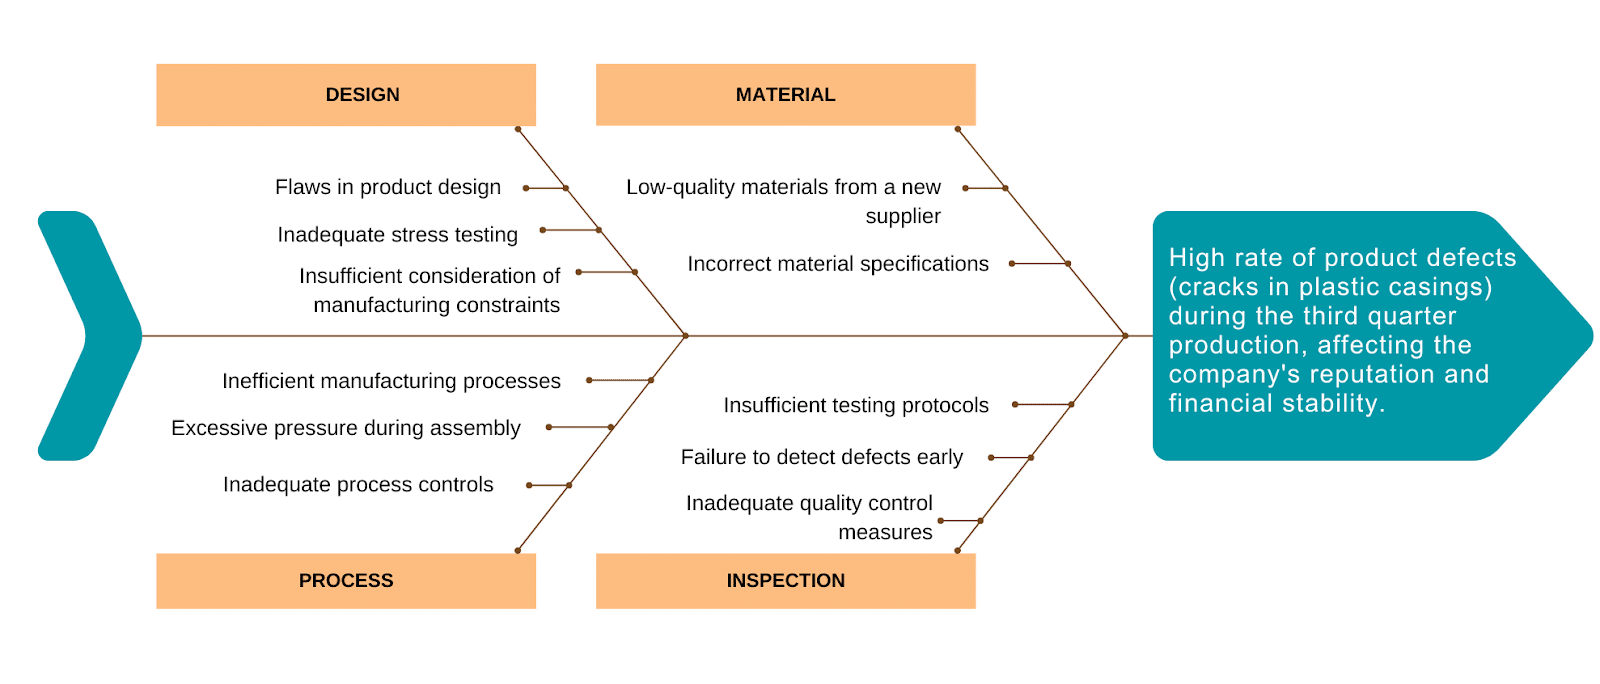
Example 3: Fishbone Diagram in Quality Management – Preventing Product Defects
In quality management, product defects can tarnish a company’s reputation and lead to financial losses. This is particularly critical in industries where the margin for error is minimal, and the expectations for product quality are high. The consequences of defective products can range from customer dissatisfaction and loss of trust to costly recalls and legal liabilities.

Problem Statement: High rate of product defects (cracks in plastic casings) during the third quarter production, affecting the company’s reputation and financial stability.
Facts gathered during a preliminary investigation of product defects:
- Time of occurrence: During the third quarter production
- Location: Assembly Line 2
- Type of defects: Cracks in plastic casings
- Inspection results: Defects were detected in 5% of the products
- Material batch: Recently switched to a new supplier
The fishbone diagram analysis revealed the following root causes:
- The new material batch from the supplier did not meet the required specifications (Material)
- Inadequate inspection processes failed to detect defects early in the production process (Inspection)
- The design of the plastic casing was not robust enough to withstand the assembly process (Design)
- The assembly process exerted excessive pressure on the casings, leading to cracks (Process)
By addressing these root causes, the company can improve product quality, reduce the incidence of defects, and maintain its reputation for reliability.
How to Get Started with Fishbone Diagrams Analysis?
Fishbone diagrams are great tools for visually organizing and analyzing the causes contributing to a specific problem or effect. Understanding the structure and construction process of these diagrams is essential for their effective utilization.
Getting Started
To effectively employ the fishbone diagram, the following steps are great starting points:
- Precisely define the problem statement and place it at the diagram’s head (your team needs to agree on this). Refrain from describing the problem in solution-oriented terms.
- Determine the primary categories of potential causes and represent them as branches stemming from the main arrow. Common categories are equipment, environmental factors, procedural elements, and personnel.
- Conduct a thorough brainstorming session for all potential causes within each category, asking “Why does this occur?” and appending them as sub-branches on the diagram.
- For each pinpointed cause, further explore by inquiring “Why?” again and adding additional sub-causes. This repetitive questioning aids in uncovering the root causes.
- Continues to ask “Why?” and generate deeper levels of causes and continue organizing them under related causes or categories. This will help you to identify and then address root causes to prevent future problems.
Understanding the Structure of Fishbone Diagrams
The anatomy of a fishbone diagram consists of major categories, such as people, methods, machines, materials, measurements, and environment, with subcategories branching off from each major category. This structured approach ensures that all potential causes are thoroughly explored and represented in the diagram.

Constructing Fishbone Diagrams
Constructing a fishbone diagram involves identifying the problem or effect at hand and then brainstorming to identify major categories and subcategories. This methodical approach allows for a comprehensive exploration of potential causes while ensuring that they are effectively organized within the diagram. Learn more about Fishbone Diagrams.
Utilizing Templates for Fishbone Diagram Creation
Templates for creating fishbone diagrams are readily available in popular software formats like Excel, Word, and PowerPoint. These templates offer ease of use and accessibility, allowing users to efficiently construct well-structured fishbone diagrams without starting from scratch.
However, if your team is looking for more versatile templates and the ability to gain better insights and analysis, generate reports, track corrective actions and collaborate with other teams, an excel file or powerpoint may not be the best options. Tools such as EasyRCA facilitate a comprehensive approach to RCA and make it simple by streamlining the process. The benefits of utilizing pre-designed templates include saving time and ensuring consistency in diagram format and presentation.
Harnessing the Potential of Fishbone Diagrams
Fishbone diagrams is an important tool in root cause analysis and quality defect prevention toolbox. Their ability to provide a comprehensive view of potential causes contributes to their widespread integration in problem-solving processes. Continuous utilization of fishbone diagrams for proactive identification of possible loopholes, highlighting their long-term benefits in preventing future mishaps.
The versatility of fishbone diagrams makes them applicable not only in product design and quality improvement but also in defect minimization, showcasing their relevance and effectiveness in diverse disciplines.
———————
I hope you found this guide to various applications of fishbone diagrams insightful and actionable! Stay tuned for more thought-provoking articles as we continue to share our knowledge. Success is rooted in a thorough understanding and consistent application, and we hope this article was a step in unlocking the full potential of Root Cause Analysis for your organization.
Reliability runs initiatives such as an online learning center focused on the proprietary PROACT® RCA methodology and EasyRCA.com software. For additional resources, visit EasyRCA Resources.
Ignite your curiosity, subscribe now!
Stay informed and connected with the latest updates by subscribing today!


Recent Comments