


With over two decades in business – spanning strategy consulting, tech startups, and executive leadership – I am committed to helping your organization thrive.
At Reliability, we’re on a mission to help enhance strategic decision-making and operational excellence through the power of Root Cause Analysis, and I hope this article will be helpful!
Our goal is to help you better understand root cause analysis by offering insights and practical tips based on years of experience. Whether you’re new to doing RCAs or a seasoned pro, we trust this will be useful in your journey towards working hard and working smart.
———————
In the dynamic landscape of business operations, identifying and addressing the underlying causes of problems is crucial for sustainable growth. Root Cause Analysis Tools play a pivotal role in this process by enabling organizations to delve deep into issues and implement effective solutions.
The Importance of Identifying Root Causes
Understanding the root causes of challenges is essential for preventing their recurrence. By utilizing best Root Cause Analysis Tools, businesses can uncover the fundamental reasons behind operational inefficiencies, customer complaints, or product defects. This proactive approach not only minimizes future disruptions but also fosters a culture of continuous improvement within the organization.
How These Tools Can Transform Your Business
Implementing RCA tools can lead to transformative outcomes for businesses. By systematically addressing underlying issues, organizations can enhance their overall efficiency, product quality, and customer satisfaction levels. Moreover, these tools empower teams to make data-driven decisions and drive positive change across various facets of the business.
1. The 5 Whys: Digging Deeper into Problems

When faced with a problem, it’s often easy to address the surface-level symptoms. However, the 5 Whys technique encourages individuals and teams to dig deeper and uncover the underlying causes that may not be immediately apparent.
What is The 5 Whys?
The 5 Whys root cause analysis is a straightforward yet powerful root cause analysis tool that involves repeatedly asking “why” to drill down to the fundamental reason behind a problem. By iteratively questioning the cause-and-effect relationships, this method helps in identifying the primary factors contributing to an issue. It enables businesses to move beyond addressing symptoms and focus on resolving the core problems at hand.
When to Use The 5 Whys in Business
This technique is particularly valuable when dealing with complex issues or recurring problems within a business setting. Whether it’s a decline in product quality, operational inefficiencies, or customer dissatisfaction, the 5 Whys can be employed to unravel the underlying causes. By utilizing this method, organizations can gain insights into systemic issues and implement targeted solutions that address the root of the problem.
- Encourages deep analysis
- Identifies fundamental causes
- Unveils systemic issues
2. Fishbone Diagram: Unraveling Complex Problem

The Fishbone Diagram, also known as the Ishikawa diagram, is a valuable tool for dissecting complex issues and identifying their root causes.
What is a Fishbone Diagram?
The Fishbone Diagram is a visual representation that allows teams to explore all potential causes contributing to a specific problem. It derives its name from its structure, resembling the skeleton of a fish with the “head” representing the problem and the “bones” representing different categories of potential causes. These categories typically include factors such as people, process, equipment, materials, environment, and management. By organizing causes into these categories, teams can systematically analyze and understand the various dimensions of an issue.
When to Use a Fishbone Diagram in Business
The Fishbone Diagram is particularly useful when tackling multifaceted problems that require comprehensive analysis. Whether it’s addressing production delays, customer complaints, or service inefficiencies, this tool enables teams to visualize all possible causes and their interrelationships. By leveraging this method during brainstorming sessions or problem-solving workshops, businesses can gain clarity on intricate issues and prioritize their efforts effectively.
- Encourages comprehensive analysis
- Visualizes interrelated causes
- Prioritizes problem-solving efforts
3. Failure Mode and Effects Analysis (FMEA): Anticipating the What-Ifs
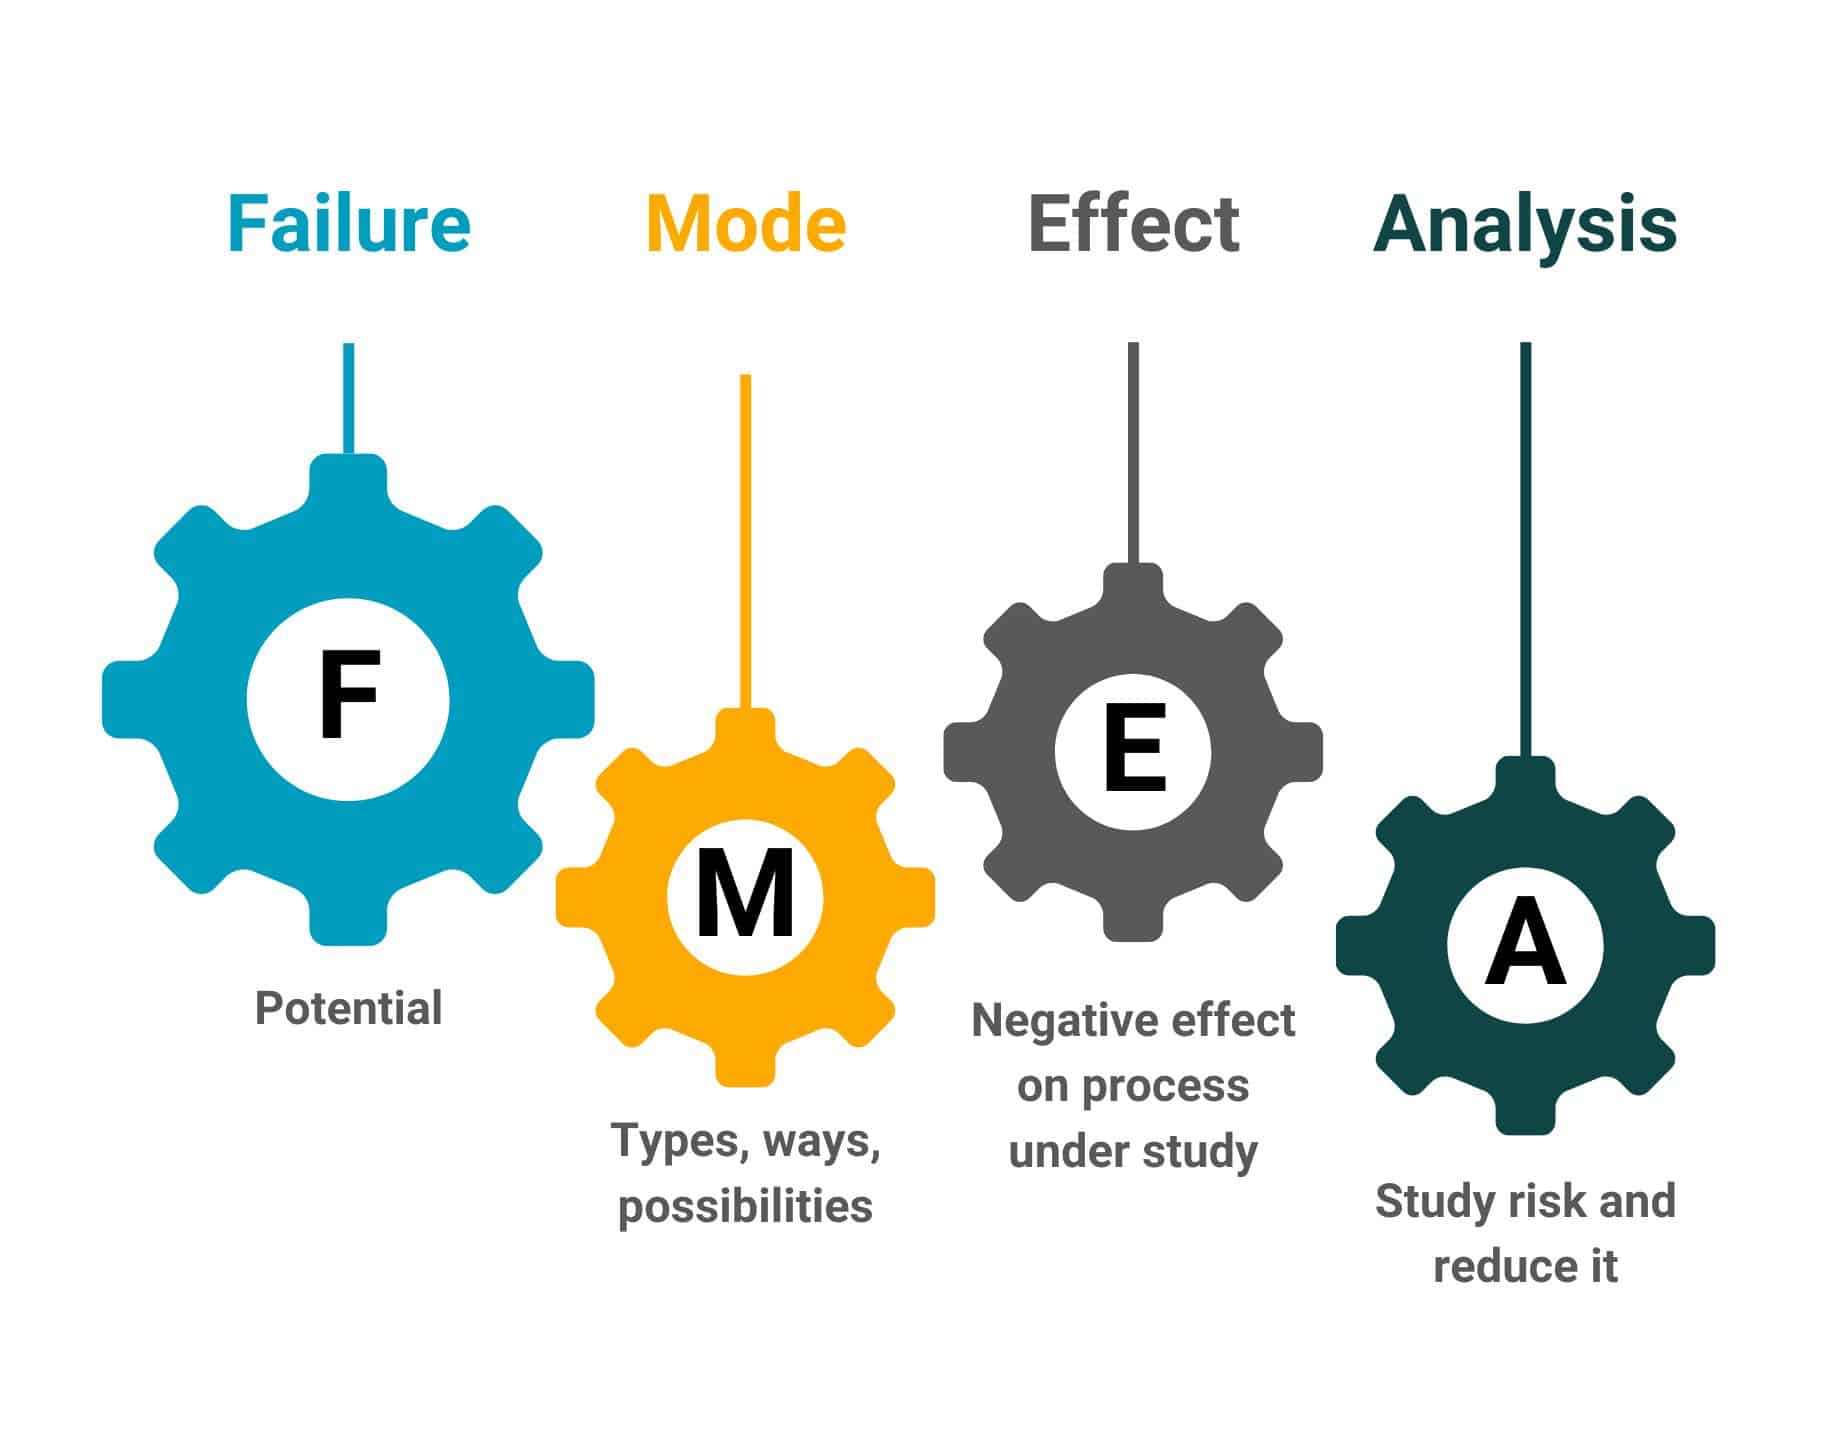
Failure Mode and Effects Analysis (FMEA) serves as a proactive tool for anticipating potential failures and their impacts on business operations. This structured approach enables organizations to identify vulnerabilities, prioritize mitigation efforts, and improve overall resilience.
What is Failure Mode and Effects Analysis (FMEA)?
Failure Mode and Effects Analysis (FMEA) is a systematic methodology aimed at identifying potential failure modes within a system, product, or process, along with assessing the severity of their effects. By scrutinizing each potential failure mode and its associated effects, businesses can preemptively address weak points in their operations. This method involves evaluating the likelihood of occurrence, detectability, and the consequences of failures to determine the most critical areas requiring attention.
When to Use FMEA in Business
Failure Mode and Effects Analysis (FMEA) is particularly valuable when introducing new products or processes, making significant changes to existing systems, or aiming to enhance overall operational robustness. By conducting FMEA during the early stages of product development or process design, organizations can proactively mitigate risks and optimize performance. Additionally, FMEA can be employed in industries where safety-critical systems are prevalent, such as aerospace, healthcare, automotive manufacturing, and engineering.
- Identifies potential failure modes
- Assesses severity of effects
- Proactively mitigates risks
4. PROACT® RCA Method
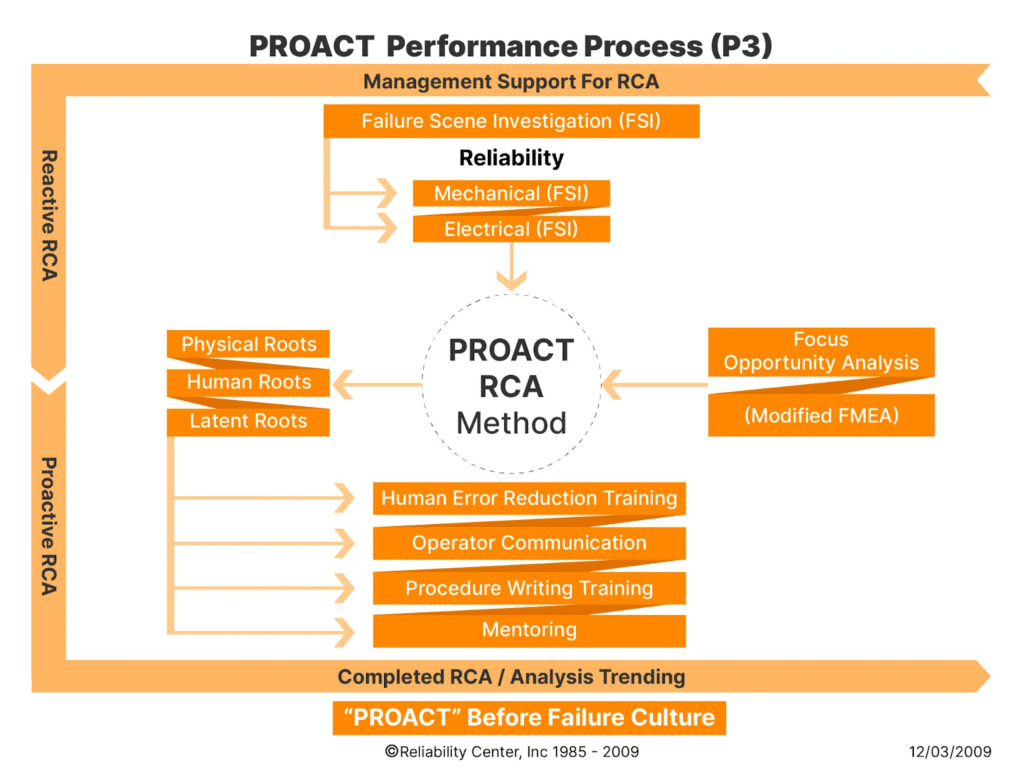
The PROACT® RCA Method is a comprehensive and systematic approach to root cause analysis, designed to identify, analyze, and solve problems effectively. This method goes beyond addressing surface-level symptoms and delves deep into the underlying causes of issues, enabling organizations to implement sustainable solutions.
What is the PROACT® RCA Method?
The PROACT® RCA Method encompasses a structured framework for problem-solving that involves several key stages. It begins with the collection of relevant data and information pertaining to the problem at hand. Subsequently, a multidisciplinary team conducts a thorough analysis using various tools and techniques to identify all potential causes. The method emphasizes the importance of identifying not only immediate causes but also underlying systemic factors that contribute to the issue. Once the root causes are identified, the team formulates effective corrective actions aimed at preventing recurrence.
This method places a strong emphasis on collaboration and cross-functional involvement, ensuring that diverse perspectives are considered during the analysis process. Additionally, it encourages organizations to adopt a proactive stance towards problem-solving by implementing measures that address fundamental weaknesses within their systems or processes.
When to Use the PROACT® RCA Method
The PROACT® RCA Method is particularly valuable when dealing with complex or recurring problems that require in-depth analysis. Whether it’s addressing persistent quality issues in manufacturing, operational disruptions in service delivery, or safety incidents in high-risk environments, this method provides a structured approach for uncovering root causes. Moreover, it is instrumental in fostering a culture of continuous improvement within an organization by promoting accountability and transparency in problem-solving efforts.
- Encourages multidisciplinary collaboration
- Emphasizes proactive problem-solving
- Fosters accountability and transparency
By leveraging the PROACT® RCA Method, businesses can gain valuable insights into their operational challenges and implement sustainable solutions that drive long-term performance improvements.
5. Fault Tree Analysis

The Basics of Fault Tree Analysis
Fault Tree Analysis (FTA) serves as a valuable tool for identifying the root causes of failures within complex systems. This method employs a top-down, deductive approach to analyze potential failure modes and their interrelationships.
At its core, Fault Tree Analysis involves the construction of a graphical diagram that depicts the logical relationships between various events and conditions leading to a specific undesired outcome. The “fault tree” structure consists of basic events, which are individual failure modes or events, and logical gates representing the relationships between these events. By systematically analyzing these relationships, organizations can gain insights into the critical combinations of factors that contribute to system failures.
When conducting Fault Tree Analysis, teams collaborate to identify all possible contributing factors and their interactions, fostering a comprehensive understanding of the system’s vulnerabilities. This method enables businesses to prioritize mitigation efforts by focusing on the most influential factors that lead to undesirable outcomes.
When Fault Tree Analysis Can Help Problem Solving
Fault Tree Analysis is particularly beneficial when addressing safety-critical systems, reliability engineering, and risk management in industries such as aerospace, nuclear power generation, and chemical processing. It provides a structured approach for evaluating potential failure scenarios and designing robust preventive measures.
Moreover, this method is instrumental in uncovering latent weaknesses within complex systems that may not be immediately apparent through traditional analysis techniques. By visualizing the interdependencies of failure modes and their contributing factors, organizations can proactively implement measures to enhance system resilience and minimize the likelihood of catastrophic events.
6. Affinity Diagram

In problem-solving and collaborative analysis, the Affinity Diagram serves as a valuable tool for organizing and synthesizing large volumes of ideas, opinions, and information into natural relationships. This method enables teams to gain a comprehensive understanding of complex issues and identify underlying patterns that may not be immediately apparent.
Understanding Affinity Diagrams
The Affinity Diagram is often employed during brainstorming sessions or problem-solving workshops to categorize diverse thoughts and concepts into related groups. By utilizing this visual representation, teams can cluster similar ideas together based on their thematic connections, facilitating the emergence of overarching themes or trends. This process encourages participants to explore the interrelationships between various elements, fostering a holistic perspective on the subject matter at hand.
When using an Affinity Diagram, participants are encouraged to contribute their insights in the form of brief statements or keywords, which are then organized into groups based on commonalities. This collaborative approach promotes engagement and inclusivity within the team, allowing diverse perspectives to converge and form cohesive clusters of ideas. Ultimately, the resulting diagram provides a structured overview of key themes and concepts, laying the groundwork for further analysis and decision-making.
When to Use Affinity Diagrams
The Affinity Diagram is particularly beneficial when addressing complex problems that involve multiple stakeholders or intricate layers of information. Whether it’s identifying improvement opportunities in processes, analyzing customer feedback trends, or exploring innovative solutions for product development, this tool offers a systematic approach to synthesizing diverse viewpoints into actionable insights.
Moreover, organizations can leverage Affinity Diagrams to streamline strategic planning exercises by consolidating inputs from cross-functional teams and aligning collective vision towards common objectives. By visually mapping out interconnected ideas and themes, businesses can foster collaboration, identify priority areas for action, and drive consensus on critical initiatives.
Utilizing an Affinity Diagram:
- Encourages inclusive participation
- Synthesizes diverse viewpoints
- Facilitates strategic alignment
By harnessing the power of Affinity Diagrams in collaborative problem-solving endeavors, businesses can unlock synergies within their teams and derive coherent strategies that address multifaceted challenges effectively.
Scatter Diagram
What is a Scatter Diagram?
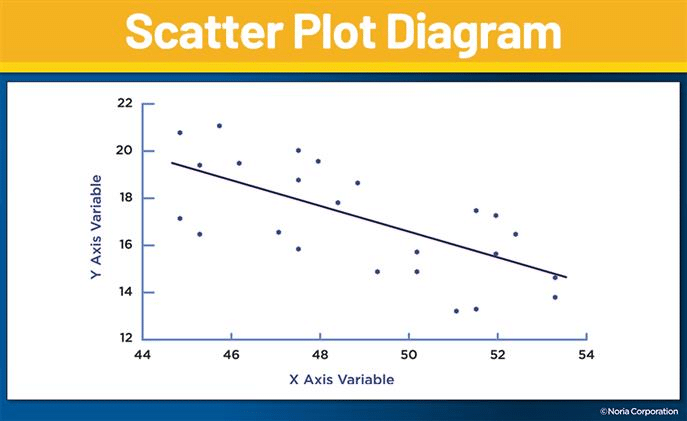
A scatter diagram, also known as a scatter plot, is a visual representation of the relationship between two variables. It consists of data points that are plotted on a Cartesian plane, with one variable on the x-axis and the other on the y-axis. The resulting pattern of points provides insights into the correlation or association between the variables, allowing for a visual assessment of potential cause-and-effect relationships.
The scatter diagram serves as a valuable tool for identifying patterns, trends, and anomalies within datasets. By visually examining the distribution of data points, teams can discern whether there is a positive correlation (both variables increase together), negative correlation (one variable increases while the other decreases), or no correlation between the variables. This graphical representation facilitates an intuitive understanding of how changes in one variable may influence another, providing crucial insights for root cause analysis.
When is Scatter Diagram Used for Root Cause Analysis?
The scatter diagram is particularly useful in root cause analysis when investigating potential relationships between factors that may contribute to an outcome or problem. By utilizing this tool, organizations can explore whether there exists a discernible connection between two variables that could be influencing a particular issue.
When faced with operational challenges such as fluctuating production outputs, varying process parameters, or inconsistent quality metrics, employing scatter diagrams can reveal underlying associations. For instance, in manufacturing processes, teams can use scatter diagrams to assess if changes in equipment settings correlate with variations in product quality. Similarly, in service-oriented industries, analyzing customer satisfaction scores against response times using scatter diagrams can unveil potential correlations impacting overall service performance.
Utilizing Scatter Diagrams:
- Reveals correlations between variables
- Identifies potential cause-and-effect relationships
- Provides visual insights into data patterns
By incorporating scatter diagrams into their root cause analysis toolkit, businesses gain a powerful means to uncover hidden relationships and make informed decisions based on empirical evidence.
8. DMAIC Template
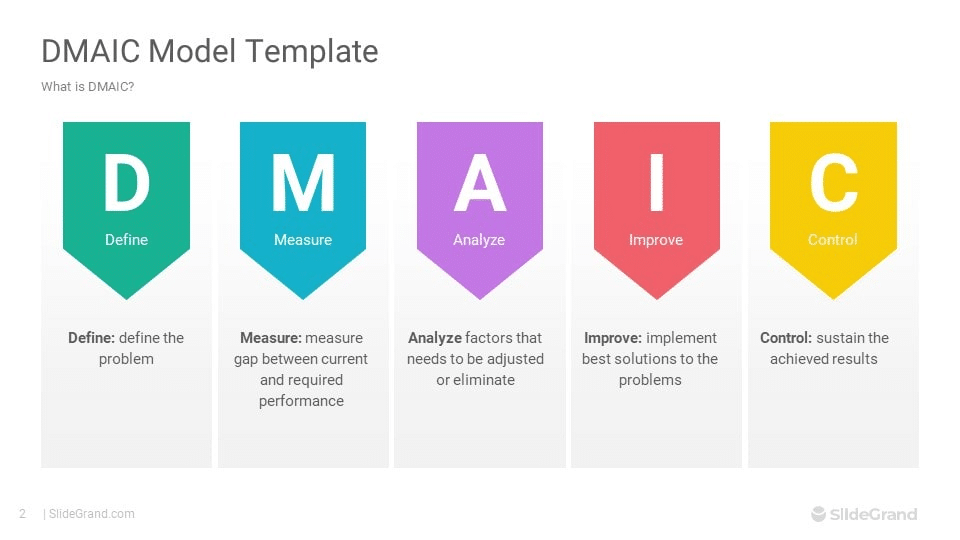
The DMAIC (Define, Measure, Analyze, Improve, Control) template is a structured problem-solving methodology that provides a systematic approach to process improvement and root cause analysis within businesses.
What is the DMAIC Template?
The DMAIC template serves as a roadmap for organizations seeking to improve the performance of existing processes or address recurring issues. It consists of five key stages:
- Define: In this initial phase, the problem or opportunity for improvement is clearly defined, along with the project goals and customer requirements. Establishing a clear understanding of the scope and objectives sets the foundation for subsequent steps.
- Measure: Once the problem is defined, relevant data and metrics are collected to quantify the current state of the process under scrutiny. This stage involves identifying critical process inputs and outputs, establishing baseline performance measures, and assessing the capability of existing systems.
- Analyze: The analysis phase focuses on delving deep into the collected data to identify potential root causes contributing to the identified problem or variation in performance. Various analytical tools and techniques are employed to uncover patterns, trends, and correlations within the data set.
- Improve: After identifying root causes through analysis, this stage involves developing and implementing solutions aimed at addressing these underlying issues. The emphasis is on generating innovative ideas, testing potential solutions, and implementing changes that lead to measurable improvements in process performance.
- Control: The final phase of DMAIC revolves around sustaining the improvements achieved by implementing robust control measures. This includes developing monitoring systems to track key process indicators, defining standard operating procedures (SOPs), and establishing mechanisms for ongoing evaluation and continuous improvement.
When to Use the DMAIC Template in Business
The DMAIC template is particularly valuable when organizations encounter persistent challenges or seek to optimize existing processes for efficiency and quality. It can be applied across various business functions including manufacturing, service delivery, supply chain management, and customer support.
This methodology is instrumental when:
- Addressing recurring operational inefficiencies
- Improving product quality or service delivery
- Optimizing resource utilization
- Enhancing customer satisfaction levels
- Streamlining complex processes with multiple variables
By leveraging the structured approach offered by the DMAIC template, businesses can systematically address underlying issues while driving sustainable improvements across their operations.
9. Pareto Charts
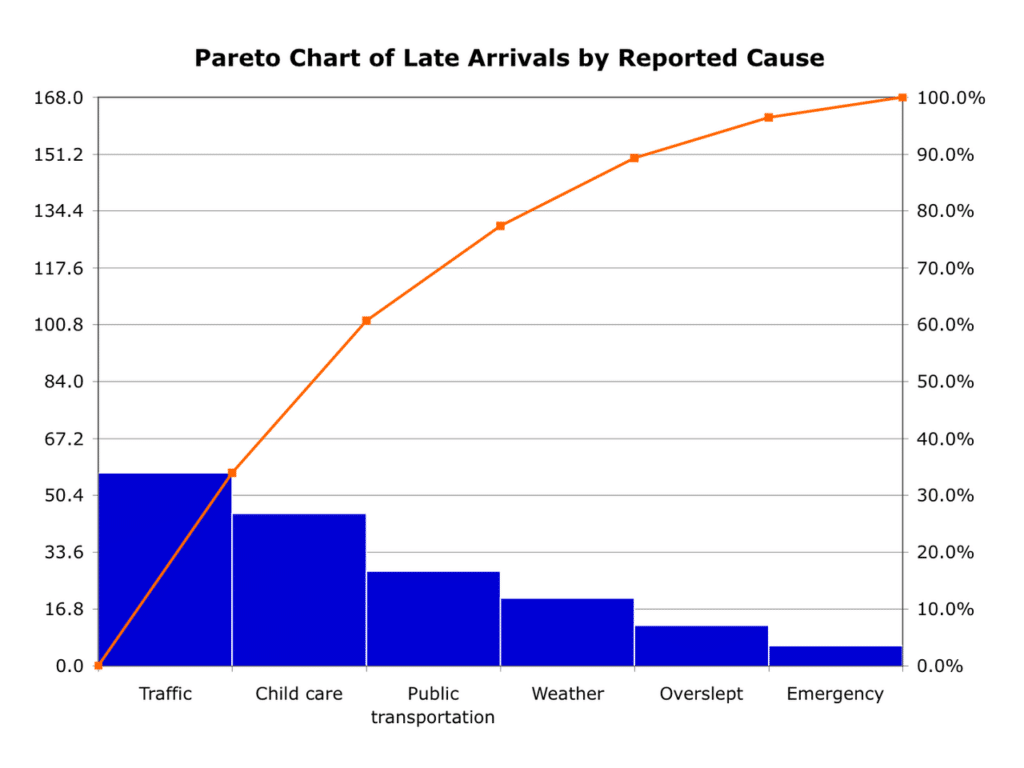
A Pareto Chart combines a bar graph with a cumulative percentage line to visually display the frequency or impact of problems. The bars are ordered from the highest to the lowest frequency along the left vertical axis, representing individual causes, while the right vertical axis tracks the cumulative percentage of these causes. This method is rooted in the Pareto Principle, which postulates that approximately 80% of effects come from 20% of the causes. This principle helps teams focus on the ‘critical few’ rather than the ‘trivial many’ by highlighting the issues that will have the greatest impact if solved.
Detailed Features of Pareto Charts
Visual Clarity: By visually sorting problems from most to least significant, Pareto Charts help teams quickly understand the landscape of issues at a glance.
Cumulative Insight: The cumulative line graph that overlays the bars provides additional insight into how many of the total issues are accounted for by addressing the most significant problems.
Data-Driven Decision-Making: By basing decisions on quantifiable data, teams can avoid common biases and focus on objectively significant issues.
When to Use a Pareto Chart in Business
Pareto Charts are particularly valuable in settings where resource allocation needs to be optimized based on the impact of potential solutions. This tool is highly effective in various business contexts:
Quality Control: In manufacturing, identifying the most frequent sources of defects can focus quality improvement measures where they are most needed.
Customer Service: Analysis of customer complaints or feedback can pinpoint major areas for service improvements.
Operational Efficiency: In operations, sorting out the most common bottlenecks or delays helps in streamlining processes and improving throughput.
Financial Analysis: Financial teams can use Pareto Charts to identify the largest areas of expense or the most significant opportunities for cost reduction.
Benefits of Using Pareto Charts in Problem Solving
Focuses efforts on major contributors to problems ensuring that the most significant issues are addressed first for maximum impact. Besides, Pareto Chart facilitates more efficient allocation of resources by highlighting areas where spending time and money will yield the most substantial improvements. It also helps with prioritization in problem-solving processes, making it easier for managers to justify decisions and align teams on critical tasks.
By leveraging the power of Pareto Charts, businesses not only streamline their problem-solving processes but also improve their overall decision-making capacity, leading to more effective management and improved operational outcomes.
Conclusion
Empowering your business through effective problem-solving is essential for sustained growth and success. By leveraging a diverse set of root cause analysis tools, organizations can proactively address operational challenges, enhance product quality, and optimize customer satisfaction levels.
The systematic approach offered by these powerful tools enables businesses to delve deep into the underlying causes of issues, fostering a culture of continuous improvement and innovation. From the simplicity of The 5 Whys to the comprehensive nature of the PROACT® RCA Method, each tool provides a unique perspective on problem-solving, catering to a wide range of business scenarios.
Moreover, the structured methodologies such as FMEA and DMAIC template offer invaluable frameworks for anticipating potential failures, optimizing processes, and driving sustainable improvements. By embracing these tools, organizations can not only mitigate risks but also capitalize on opportunities for growth and development.
Integrating root cause analysis tools into your problem-solving equips your business with the capabilities to navigate challenges effectively while laying the groundwork for long-term success. Embracing these methodologies fosters a proactive approach towards addressing issues and empowers teams to drive positive change across various facets of the organization.
———————
I hope you found this 9 powerful root cause analysis tool insightful and actionable! Stay tuned for more thought-provoking articles as we continue to share our knowledge. Success is rooted in a thorough understanding and consistent application, and we hope this article was a step in unlocking the full potential of Root Cause Analysis for your organization.
Reliability runs initiatives such as an online learning center focused on the proprietary PROACT® RCA methodology and EasyRCA.com software. For additional resources, visit EasyRCA Resources.
Ignite your curiosity, subscribe now!
Stay informed and connected with the latest updates by subscribing today!


Recent Comments