

At Reliability, we’re on a mission to help enhance strategic decision-making and operational excellence through the power of Root Cause Analysis, and I hope this article will be helpful!
Our goal is to help you better understand root cause analysis by offering insights and practical tips based on years of experience. Whether you’re new to doing RCAs or a seasoned pro, we trust this will be useful in your journey towards working hard and working smart.
———————
Fishbone diagrams, also known as Ishikawa or cause-and-effect diagrams, are a powerful root cause analysis tool utilized across various industries, including healthcare. These diagrams visually map out potential causes contributing to a specific problem, making it easier to identify root causes and implement effective solutions. Their structured approach to problem-solving facilitates in-depth analysis, playing a crucial role in enhancing patient safety by addressing underlying issues before they escalate.
Understanding the Fishbone Diagram
A fishbone diagram is a visual tool used to systematically identify and analyze the root causes of a specific problem or effect. Originally developed by Dr. Kaoru Ishikawa, a pioneer in quality management, this diagram helps healthcare teams identify factors contributing to patient safety issues, allowing them to address the root causes effectively.
We have discussed the Fishbone Diagram in detail in our previous article. In this post, let’s dive into the components and its application in the healthcare industry.
Key Components of a Healthcare Fishbone Diagram
The main goal of a healthcare fishbone diagram is to visually map out and systematically analyze the different factors contributing to patient safety issues or adverse events. By pinpointing and categorizing these factors, healthcare teams can create targeted solutions to achieve desired outcomes while minimizing risks. Let’s dive into the essential parts of a fishbone diagram:
Problem Statement
Start by clearly defining the patient safety issue or adverse event. This forms the “head” of the fish and is the main focus of your analysis. A well-defined problem statement keeps the team focused and aligned in uncovering the root causes.
Major Categories of Causes
Next, identify the major categories of causes, which make up the “bones” branching off the spine of the diagram. These categories help organize potential causes and ensure a thorough analysis.
Typical categories in a healthcare fishbone diagram include:
People:
Factors related to the staff, patients, or anyone involved in the care process:
- Training: Are staff adequately trained and knowledgeable?
- Communication: Is there clear communication among team members?
- Staffing Levels: Are there enough staff members to provide adequate care?
Processes: This covers procedures, protocols, and workflows used in patient care:
- Efficiency: Are the current processes streamlined and effective?
- Error-prone: Are there steps in the workflow that are prone to errors?
Equipment: Consider the tools, devices, and technology used in patient care:
- Maintenance: Is the equipment well-maintained and regularly checked?
- Functionality: Are the tools and devices up to date and working properly?
Environment
Look at the physical and organizational environment where care is provided:
- Cleanliness: Is the environment clean and sanitary?
- Noise Levels: Are noise levels controlled to prevent disturbances?
- Layout: Is the workspace layout safe and efficient?
Materials
This includes medications, supplies, and other consumables used in patient care:
- Safety: Are the materials safe and free from contamination?
- Availability: Are the necessary materials readily available when needed?
Management
Consider policies, administration, and organizational factors that influence patient care:
- Policies: Are there clear and effective policies in place?
- Administration: How do management practices impact daily operations and patient safety?
- Organizational Culture: Does the culture promote safety and accountability?
Sub-causes
Within each major category, identify specific causes that might contribute to the problem. These form smaller branches off each “bone,” giving a detailed view of potential issues. For example, under “People,” sub-causes could include insufficient training programs or poor communication channels. The more specific the information, the better the outcome of the analysis, as it helps in accurately identifying root causes and developing targeted interventions.
Implementing Fishbone Diagrams in Healthcare Settings
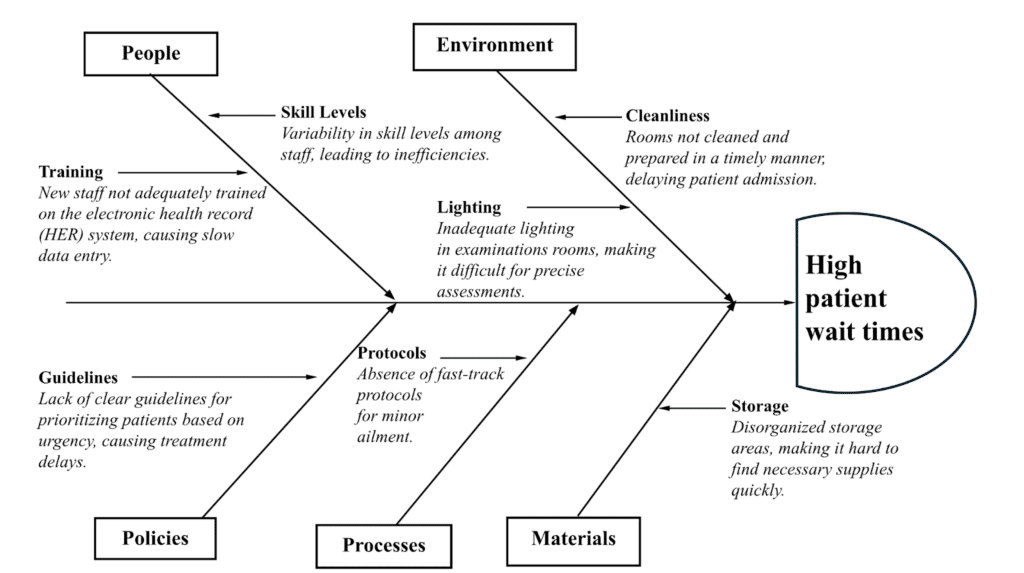
Imagine you’re part of a healthcare team facing a recurring issue with high patient wait times. The first step is to bring together a diverse group of professionals directly involved in patient care. You gather nurses, doctors, support staff, and a few administrative personnel to ensure a wide range of perspectives. This team starts by holding brainstorming sessions where everyone shares their thoughts on why these long wait times may happen. Each idea is categorized into the major sections of the fishbone diagram — people, processes, equipment, environment, materials, and management. It’s an enlightening experience as team members open up about their daily challenges and observations, painting a comprehensive picture of the issue.
Once all potential causes are listed, the real detective work begins. The team dives deep into analyzing these causes, prioritizing them based on how often they occur and their impact on patient wait times. This focused approach helps identify the most pressing issues, such as inefficient scheduling processes, inadequate staff training, and outdated equipment. The team then develops specific action plans to tackle these root causes. For example, they decide to revamp the scheduling system to reduce bottlenecks, enhance staff training programs to improve efficiency and upgrade equipment to speed up diagnostics. Each action plan is detailed, with clear steps and assigned responsibilities.
As these plans are put into action, the team doesn’t stop there. They continuously monitor the effectiveness of these interventions, using the fishbone diagram as a living document that evolves with new insights. Regular meetings are held to review progress, celebrate successes, and make necessary adjustments. This ongoing commitment to improvement ensures that patient wait times steadily decrease, and the team feels a collective sense of achievement. The story of tackling high patient wait times with a fishbone diagram becomes a powerful example of how collaboration and structured analysis can lead to real, meaningful change in healthcare.

Benefits of Using Healthcare Fishbone Diagrams
Numerous tools and strategies have come and gone. However, one tool that has consistently proven its value is the healthcare fishbone diagram. This structured, visual method offers a range of benefits that can significantly enhance patient safety and overall care quality.
Comprehensive Analysis
Fishbone diagrams provide a systematic way to explore all possible causes of a problem, ensuring nothing is overlooked. This comprehensive analysis is essential for identifying the true root causes of safety issues. It’s like turning over every stone to ensure we understand all aspects of a problem, rather than just scratching the surface.
Encouraging Collaboration
Creating a fishbone diagram is inherently a team effort. By involving healthcare professionals from various disciplines, you get a wealth of insights and experiences. This collaborative approach leads to a more thorough understanding of the problem and also fosters a culture of open communication. When everyone from nurses to administrators contributes their perspective, the team can work together more effectively.
Identifying Root Causes
One of the standout benefits of fishbone diagrams is their ability to help teams pinpoint underlying causes, not just the symptoms. By focusing on these root causes, healthcare teams can develop solutions that are both effective and long-lasting. Too many quick fixes only address the symptoms and not the root cause. Fishbone diagrams encourage us to dig deeper and solve problems at their core.
Creating Actionable Solutions
The structured nature of fishbone diagrams makes it easier to develop targeted interventions. Once you’ve identified the root causes, you can create specific, actionable plans to address them. This methodical approach ensures that the solutions are practical and directly related to the identified issues, leading to more successful outcomes. It’s about creating a roadmap everyone can follow, with clear steps and responsibilities.
Promoting Continuous Improvement
Fishbone diagrams aren’t just a one-time tool. They’re part of a continuous commitment to quality and safety. Regular use of these diagrams promotes an ongoing assessment and refinement of processes. In my experience, this proactive approach helps teams stay ahead of potential safety issues, continuously improving their practices and providing safer patient care.
In summary, healthcare fishbone diagrams offer a robust framework for enhancing patient safety through comprehensive analysis, collaborative problem-solving, identification of root causes, creation of actionable solutions, and promotion of continuous improvement. By integrating this tool into regular practices, healthcare teams can ensure a higher standard of care and a safer environment for patients. This tool has been a game-changer for many, and I believe it will continue to be invaluable for future generations of healthcare professionals.
Conclusion
Improving patient safety is an ongoing challenge in healthcare, but the healthcare fishbone diagram offers a robust method for identifying and addressing the root causes of safety issues. By systematically analyzing problems and developing targeted solutions, healthcare providers can enhance the quality of care and ensure better patient outcomes. Implementing this tool effectively requires collaboration, thorough analysis, and a commitment to continuous improvement.
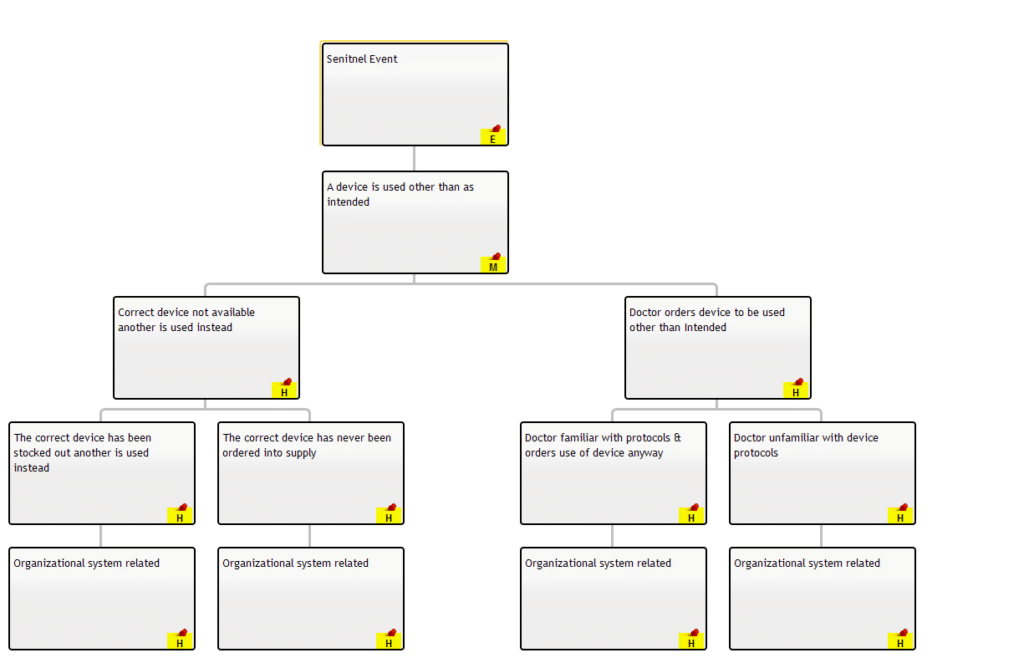
Embrace the fishbone diagram and make it a part of your patient safety strategy today. Besides the fishbone diagram, you can utilize various logic trees available on EasyRCA for system improvements.

___________
I hope you found this article on Improving Patient Safety with Fishbone Diagrams insightful and actionable! Stay tuned for more thought-provoking articles as we continue to share our knowledge. Success is rooted in a thorough understanding and consistent application, and we hope this article was a step in unlocking the full potential of Root Cause Analysis for your organization.
Reliability runs initiatives such as an online learning center focused on the proprietary PROACT® RCA methodology and EasyRCA.com software. For additional resources, visit EasyRCA Resources.
Ignite your curiosity, subscribe now!
Stay informed and connected with the latest updates by subscribing today!

